You can learn a great deal from reading and comparing the financial filings of two close competitors. Tech-finance nerd that I am, you can imagine how excited I was to see Lyft’s and Uber’s respective S-1’s become public within mere weeks of each other.
While the general financial press has covered a lot of the top-level figures on profitability (or lack thereof) and revenue growth, I was more interested in understanding the unit economics — what is the individual “unit” (i.e. a user, a sale, a machine, etc.) of the business and what does the history of associated costs and revenues say about how the business will (or will not) create durable value over time.
For two-sided regional marketplaces like Lyft and Uber, an investor should understand the full economic picture for (1) the users/riders, (2) the drivers, and (3) the regional markets. Sadly, their S-1’s don’t make it easy to get much on (2) or (3) — probably because the companies consider the pertinent data to be highly sensitive information. They did, however, provide a fair amount of information on users/riders and rides and, after doing some simple calculations, a couple of interesting things emerged
Uber’s Users Spend More, Despite Cheaper Rides
As someone who first knew of Uber as the UberCab “black-car” service, and who first heard of Lyft as the Zimride ridesharing platform, I was surprised to discover that Lyft’s average ride price is significantly more expensive than Uber’s and the gap is growing! In Q1 2017, Lyft’s average bookings per ride was $11.74 and Uber’s was $8.41, a difference of $3.33. But, in Q4 2018, Lyft’s average bookings per ride had gone up to $13.09 while Uber’s had declined to $7.69, increasing the gap to $5.40.
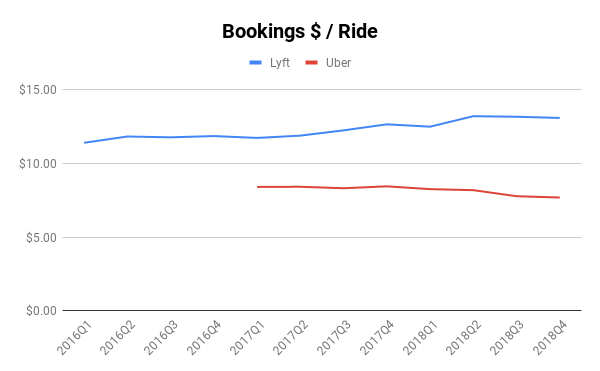
This is especially striking considering the different definitions that Lyft and Uber have for “bookings” — Lyft excludes “ pass-through amounts paid to drivers and regulatory agencies, including sales tax and other fees such as airport and city fees, as well as tips, tolls, cancellation, and additional fees” whereas Uber’s includes “ applicable taxes, tolls, and fees “. This gap is likely also due to Uber’s heavier international presence (where they now generate 52% of their bookings). It would be interesting to see this data on a country-by-country basis (or, more importantly, a market-by-market one as well).
Interestingly, an average Uber rider appears to also take ~2.3 more rides per month than an average Lyft rider, a gap which has persisted fairly stably over the past 3 years even as both platforms have boosted the number of rides an average rider takes. While its hard to say for sure, this suggests Uber is either having more luck in markets that favor frequent use (like dense cities), with its lower priced Pool product vs Lyft’s Line product (where multiple users can share a ride), or its general pricing is encouraging greater use.
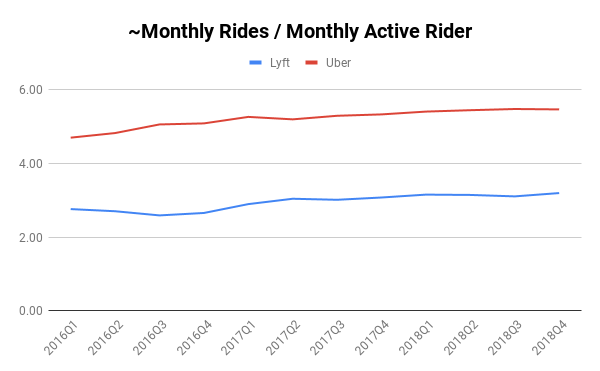
Note: the “~monthly” that you’ll see used throughout the charts in this post are because the aggregate data — rides, bookings, revenue, etc — given in the regulatory filings is quarterly, but the rider/user count provided is monthly. As a result, the figures here are approximations based on available data, i.e. by dividing quarterly data by 3
What does that translate to in terms of how much an average rider is spending on each platform? Perhaps not surprisingly, Lyft’s average rider spend has been growing and has almost caught up to Uber’s which is slightly down.
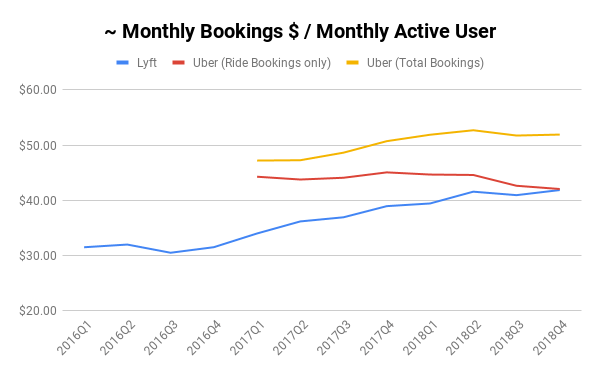
However, Uber’s new businesses like UberEats are meaningfully growing its share of wallet with users (and nearly perfectly dollar for dollar re-opens the gap on spend per user that Lyft narrowed over the past few years). In 2018 Q4, the gap between the yellow line (total bookings per user, including new businesses) and the red line (total bookings per user just for rides) is almost $10 / user / month! Its no wonder that in its filings, Lyft calls its users “riders”, but Uber calls them “Active Platform Consumers”.
Despite Pocketing More per Ride, Lyft Loses More per User
Long-term unit profitability is more than just how much an average user is spending, its also how much of that spend hits a company’s bottom line. Perhaps not surprisingly, because they have more expensive rides, a larger percent of Lyft bookings ends up as gross profit (revenue less direct costs to serve it, like insurance costs) — ~13% in Q4 2018 compared with ~9% for Uber. While Uber’s has bounced up and down, Lyft’s has steadily increased (up nearly 2x from Q1 2017). I would hazard a guess that Uber’s has also increased in its more established markets but that their expansion efforts into new markets (here and abroad) and new service categories (UberEats, etc) has kept the overall level lower.
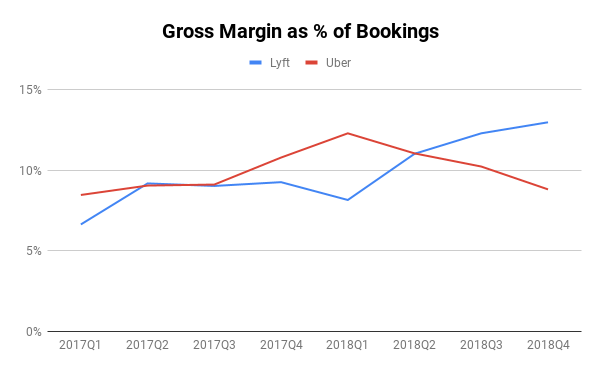
Note: the gross margin I’m using for Uber adds back a depreciation and amortization line which were separated to keep the Lyft and Uber numbers more directly comparable. There may be other variations in definitions at work here, including the fact that Uber includes taxes, tolls, and fees in bookings that Lyft does not. In its filings, Lyft also calls out an analogous “Contribution Margin” which is useful but I chose to use this gross margin definition to try to make the numbers more directly comparable.
The main driver of this seems to be higher take rate (% of bookings that a company keeps as revenue) — nearly 30% in the case of Lyft in Q4 2018 but only 20% for Uber (and under 10% for UberEats)
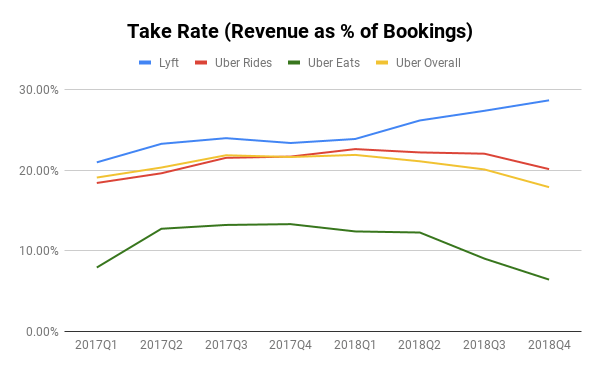
Note: Uber uses a different definition of take rate in their filings based on a separate cut of “Core Platform Revenue” which excludes certain items around referral fees and driver incentives. I’ve chosen to use the full revenue to be more directly comparable
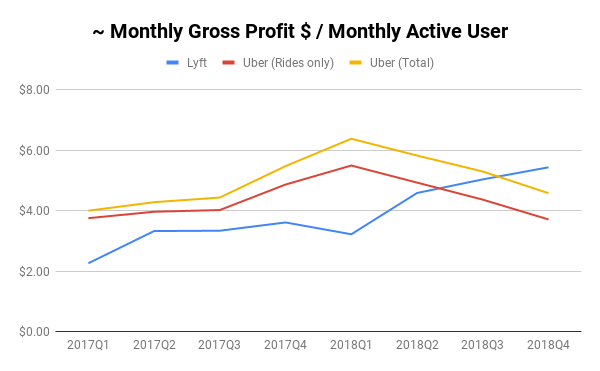
The higher take rate and higher bookings per user has translated into an impressive increase in gross profit per user. Whereas Lyft once lagged Uber by almost 50% on gross profit per user at the beginning of 2017, Lyft has now surpassed Uber even after adding UberEats and other new business revenue to the mix.
All of this data begs the question, given Lyft’s growth and lead on gross profit per user, can it grow its way into greater profitability than Uber? Or, to put it more precisely, are Lyft’s other costs per user declining as it grows? Sadly, the data does not seem to pan out that way
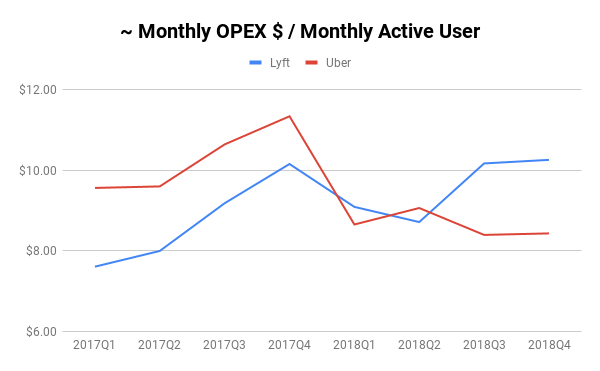
While Uber had significantly higher OPEX (expenditures on sales & marketing, engineering, overhead, and operations) per user at the start of 2017, the two companies have since reversed positions, with Uber making significant changes in 2018 which lowered its OPEX per user spend to under $9 whereas Lyft’s has been above $10 for the past two quarters. The result is Uber has lost less money per user than Lyft since the end of 2017
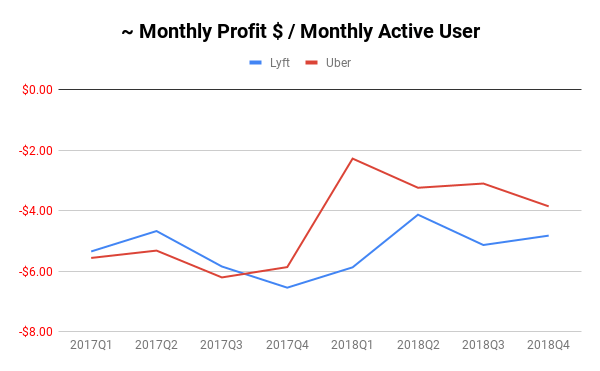
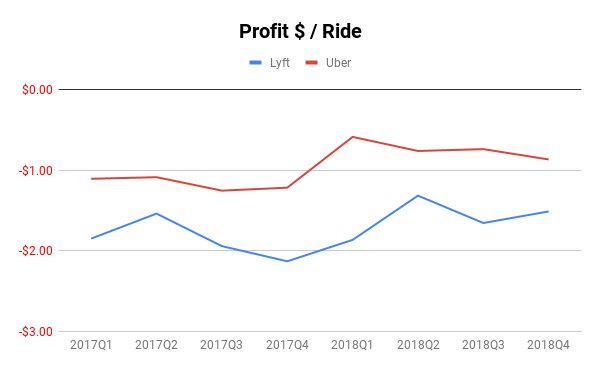
The story is similar for profit per ride. Uber has consistently been more profitable since 2017, and they’ve only increased that lead since. This is despite the fact that I’ve included the costs of Uber’s other businesses in their cost per ride.
Does Lyft’s Growth Justify Its Higher Spend?
One possible interpretation of Lyft’s higher OPEX spend per user is that Lyft is simply investing in operations and sales and engineering to open up new markets and create new products for growth. To see if this strategy has paid off, I took a look at the Lyft and Uber’s respective user growth during this period of time.
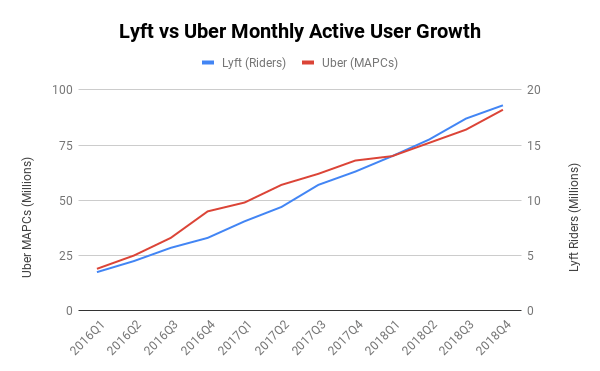
The data shows that Lyft’s compounded quarterly growth rate (CQGR) from Q1 2016 to Q4 2018 of 16.4% is only barely higher than Uber’s at 15.3% which makes it hard to justify spending nearly $2 more per user on OPEX in the last two quarters.
Interestingly, despite all the press and commentary about #deleteUber, it doesn’st seem to have really made a difference in their overall user growth (its actually pretty hard to tell from the chart above that the whole thing happened around mid-Q1 2017).
How are Drivers Doing?
While there is much less data available on driver economics in the filings, this is a vital piece of the unit economics story for a two-sided marketplace. Luckily, Uber and Lyft both provide some information in their S-1’s on the number of drivers on each platform in Q4 2018 which are illuminating.
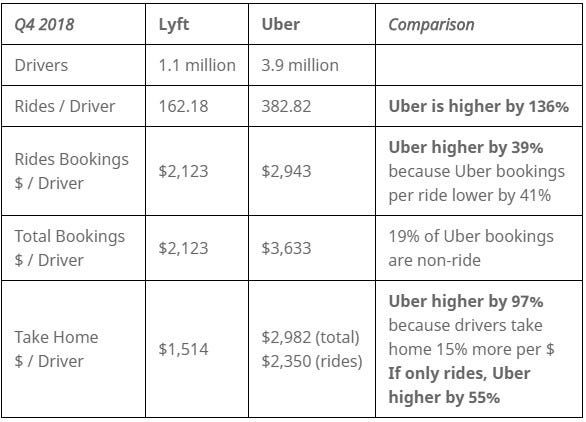
The average Uber driver on the platform in Q4 2018 took home nearly double what the average Lyft driver did! They were also more likely to be “utilized” given that they handled 136% more rides than the average Lyft driver and, despite Uber’s lower price per ride, saw more total bookings.
It should be said that this is only a point in time comparison (and its hard to know if Q4 2018 was an odd quarter or if there is odd seasonality here) and it papers over many other important factors (what taxes / fees / tolls are reflected, none of these numbers reflect tips, are some drivers doing shorter shifts, what does this look like specifically in US/Canada vs elsewhere, are all Uber drivers benefiting from doing both UberEats and Uber rideshare, etc). But the comparison is striking and should be alarming for Lyft.
Closing Thoughts
I’d encourage investors thinking about investing in either to do their own deeper research (especially as the competitive dynamic is not over one large market but over many regional ones that each have their own attributes). That being said, there are some interesting takeaways from this initial analysis
- Lyft has made impressive progress at increasing the value of rides on its platform and increasing the share of transactions it gets. One would guess that, Uber, within established markets in the US has probably made similar progress.
- Despite the fact that Uber is rapidly expanding overseas into markets that face more price constraints than in the US, it continues to generate significantly better user economics and driver economics (if Q4 2018 is any indication) than Lyft.
- Something happened at Uber at the end of 2017/start of 2018 (which looks like it coincides nicely with Dara Khosrowshahi’s assumption of CEO role) which led to better spending discipline and, as a result, better unit economics despite falling gross profits per user
- Uber’s new businesses (in particular UberEats) have had a significant impact on Uber’s share of wallet.
- Lyft will need to find more cost-effective ways of growing its business and servicing its existing users & drivers if it wishes to achieve long-term sustainability as its current spend is hard to justify relative to its user growth.
Special thanks to Eric Suh for reading and editing an earlier version!
Thought this was interesting or helpful? Check out some of my other pieces on investing / finance.