One of the great lessons of the last few years of geopolitics and economics is that it’s not enough to simply have moral/legal authority and money, real power and prosperity requires actual physical inventory and manufacturing capacity.
In a world where Russia is willing to buck sanctions and condemnation to invade a sovereign nation and where trade barriers / epidemics can cut off critical supplies, the ability to produce weapons and medical equipment can be life or death.
It’s no wonder, then, that Taiwan, a mere 100 miles away from a Russian ally/sponsor who denies its independence, has found it wise to start building up its own military production. Learning from Ukraine’s (and now Iran’s) successes with drones against a larger attacker and tapping into growing Western concerns about the China-Russia-Iran axis, they’ve started building drone technology devoid of Chinese parts (“non-red” so to speak), many of which appear to have already been deployed to Ukraine.
In an era where piloted (and eventually autonomous) drone swarms will become a much greater part of warfare, this technological and, just as important, manufacturing capability is vital not only to Taiwan but to the West as it increasingly enters a Cold War with China and its allies.
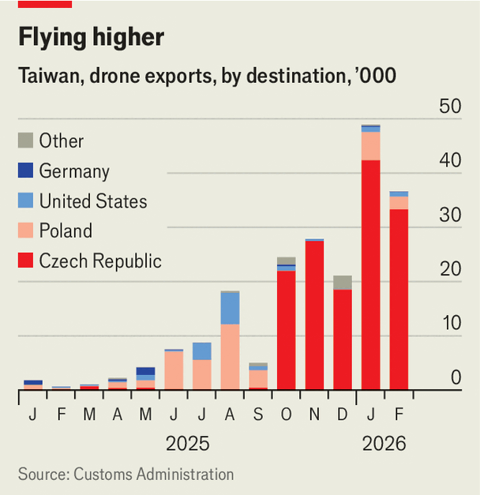
Before 2025 Taiwan’s defence exports consisted mainly of some old helicopters and small boats donated to African and Latin American countries.
That is changing as Taiwan positions itself as a supplier of “non-red” unmanned aerial vehicles or UAVs—ie, without Chinese parts—to America, its allies and other countries worried about China’s espionage and control over industrial supply chains. Taiwan’s production of UAVs has increased from about 10,000 units in 2024 to more than 12 times that in 2025. Its exports rose more than 35-fold to about 123,000 units last year—almost all its output.
The Czech Republic was its biggest buyer, followed by Poland (see chart). Industry insiders say their purchases mostly went to Ukraine, where many are used on the battlefield, giving valuable feedback on their performance. Another bumper year for exports is expected in 2026, after reaching 85,500 units in the first two months.
Taiwan launched its drone programme after observing Ukraine’s use of the technology. The main aim was to equip Taiwan’s own armed forces, which had just a few hundred drones. China had tens of thousands. Taiwan has since pledged to build an entirely non-red UAV industry by the end of 2026, with annual output of 180,000 units by 2028. Last year it also promised to buy more than 200,000 drones for its own armed forces by 2033.
When I was an elementary school student and first heard of “global warming”, I thought the solution to climate change was simple: just plant more trees! 🌳
While I now know there’s a great deal more complexity to the problem than that, I have always wondered what would happen if someone had tried out that little boy’s instinct.
In a recent article in Earth’s Future, scientists took a look, taking advantage of China’s massive investment over decades in planting trees around the country, “which accounted for 25% of the global net increase in leaf area [between] 2000–2017”! In particular, they found that, while they were able to impact dust storms and desertification, the rapid planting of trees had major negative impacts on underground water supplies as the massive resulting evapotranspiration (literally plants pulling water from the ground and into the air) effectively transferred that groundwater into rainwater over the Tibetan Plateau!
China, especially its Northern/Northwestern regions, have major issues with water availability and drought and it is a cosmic irony that an attempt to stop desertification, while greening much of the land, may have resulted in worsening the water condition.
It is a humbling reminder that large-scale well-intention actions may have adverse consequences and a reminder that, while we should pursue indirect avenues for mitigating climate change, there is probably no substitute for ultimately cutting down on the emissions and activities that are most directly related.
Their model shows that land restoration increased evapotranspiration by around 1.7 millimeters per year and precipitation by about 1.2 millimeters per year, yet overall water availability still went down.
The main driver was forest expansion in the humid east and large-scale restoration in the northwest and on the plateau. As deep-rooted trees pull water from the soil and release it into the air, they act a bit like giant pumps. The process cools the local surface but also ships moisture downwind, where it can fall as rain far from the place where it was originally stored.
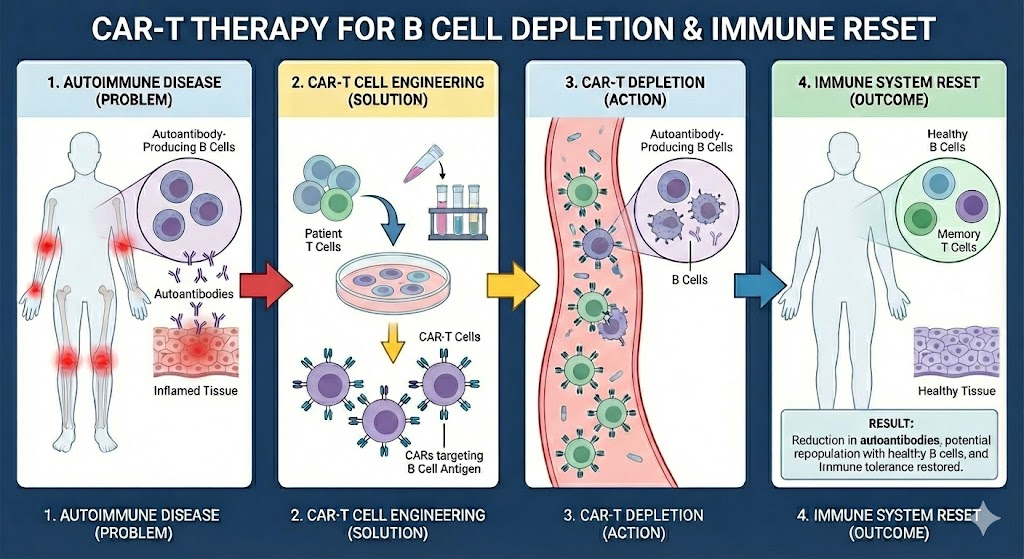
Immune cell therapies like CAR-T continue to provide some nearly miraculous therapeutic power. In addition to handling solid tumors, it turns out CAR-T can also be used to treat autoimmune disorders like lupus, rheumatoid arthritis, and ulcerative colitis.
By engineering CAR-T cells to attack B-cells, the body’s factories for the autoantibodies that do the damage in an autoimmune disorder, you not only eliminates the direct source of the problem (the autoantibodies), you potentially trigger an “immune reset” which seems to durably eliminate the problem (see diagram)!
How CAR-T for Autoimmune Disorders works (Source: Gemini Nano Banana)
Medical researchers rarely throw the word “cure” around, but this Nature News article does so 4 times! We live in interesting times!
Thoughts
The results of the trial were “much better than we could imagine”, says Du, and might be due to CAR T cells triggering the total depletion of dysfunctional B cells that attack the body’s tissues. “The immune system had to reset not only B cells, but also the rest of the immune system,” he adds, potentially allowing new, healthy B cells to replace the dysfunctional cells.
What makes this social change — where parents, especially in East and Southeast Asia, previously heavily favored having male children and now much less so — extra surprising is that many of the technological factors that drove the gender selection preference (such as access to early gender testing and IVF) have dramatically improved over time.
The fading of boy preference in regions where it was strongest has been astonishingly rapid. The natural ratio is about 105 boy babies for every 100 girls; because boys are slightly more likely to die young, this leads to rough parity at reproductive age. The sex ratio at birth, once wildly skewed across Asia, has become more even. In China it fell from a peak of 117.8 boys per 100 girls in 2006 to 109.8 last year, and in India from 109.6 in 2010 to 106.8. In South Korea it is now completely back to normal, having been a shocking 115.7 in 1990.
The reason is that while new AI agent based services and products are becoming better at replacing humans at certain tasks:
Many tasks are not automatable — especially ones where the “product/service” is actual human interaction and judgement. And those tasks tend to be the ones that take the longest and the most people to do.
AI tools are great at answering questions and doing assigned tasks. But you still need a person with actual judgement and experience to ask the right questions and assign the right tasks
While the above three advantages may ultimately disappear as technology improves, in general, I am optimistic that, by making workers more productive overall, AI technology will make workers more valuable overall.
The one exception that I immediately saw, however, were entry-level knowledge workers. New (and, in most cases, young) knowledge workers (engineers, designers, analysts, writers, management consultants, etc) are uniquely not valuable when they first start a job. They lack context, judgement, and skill. They tend to only prove their value after they’ve had the chance to learn on the job. Historically, the bargain was that entry-level knowledge workers would start with relatively lower-value tasks that would, through time and exposure, help them learn the context, judgement, and skills they would need to become productive. This is, after all, the path I took as a novice management consultant and later investor.
But with new AI tools, the case for hiring these entry-level knowledge workers dramatically weakens. Claude Code might not be able to replace the judgement of a senior architect, but it can probably get up to speed on a codebase faster, write code more accurately, and all without needing rest or paid time off than a fresh-out-of-school developer. Gemini might not be able to have the same type of insights as someone with a deep rolodex in an industry, but it will certainly know more and can conduct & summarize internet research much faster than a freshly minted consultant. ChatGPT might not be able to capture the artistry or investigation skills of a Pulitzer Prize winning journalist, but it can definitely write up summaries of stock market movements or the press releases from a company better than a novice journalist.
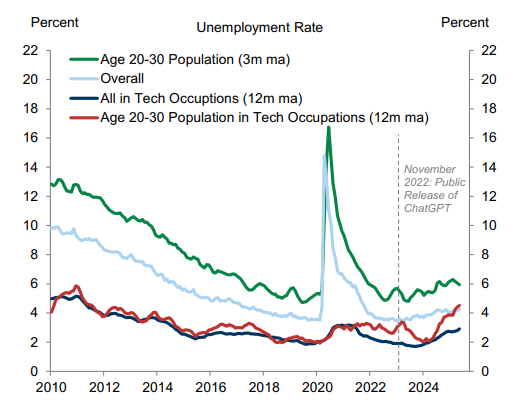
This is ultimately self-defeating — as without new junior talent, where does one find good middle-level or senior talent — but it’s also something that I fear we are already beginning to see. This Goldman Sachs research report I just read has a great Exhibit 4 showing how while new AI tools have not significantly impacted employment in general or even employment in tech, it has meaningfully increased unemployment in 20-somethings who work in tech (see image below), exactly the demographic who’s value as entry-level workers has now been largely displaced by AI.
How the tech industry (and other knowledge work professions) ultimately choose to handle this will be the defining test of how we incorporate AI into our economic lives.
Over just the last few years, AI does appear to be hurting the employment prospects of the most closely exposed workers, such as young technology workers (Exhibit 4, left). Our global economics team recently showed that employment growth has turned negative in the most AI-exposed industries, but that the aggregate labor market impact remains limited so far.
While those discussions raged, Chinese companies like the telecom infrastructure giant Huawei took the low cost open source DeepSeek model and have turned it into a business targeting countries in Africa which have already been the beneficiary of substantial Chinese investment.
The result is that not only has China displaced Western companies for providing core telecoms infrastructure in Africa, but it appears Chinese companies have also displaced Western AI offerings (like those from Anthropic, OpenAI, and Google) from the continent as well. By offering lower per token prices and by having a technical backbone that uses fewer tokens per request (Chinese models employ tokenizers with larger vocabularies to handle multi-lingual data which results in fewer tokens for words in non-English languages) and being offered by partners who have already built much of their digital infrastructure, Chinese models (and especially DeepSeek) have become ascendant in Africa.
While this has led to some problems (for example, Chinese AI model providers disabled their image recognition systems during the Chinese 高考 gaokao, or annual undergraduate admissions exam), the token economics are difficult to resist for AI adopters in Africa.
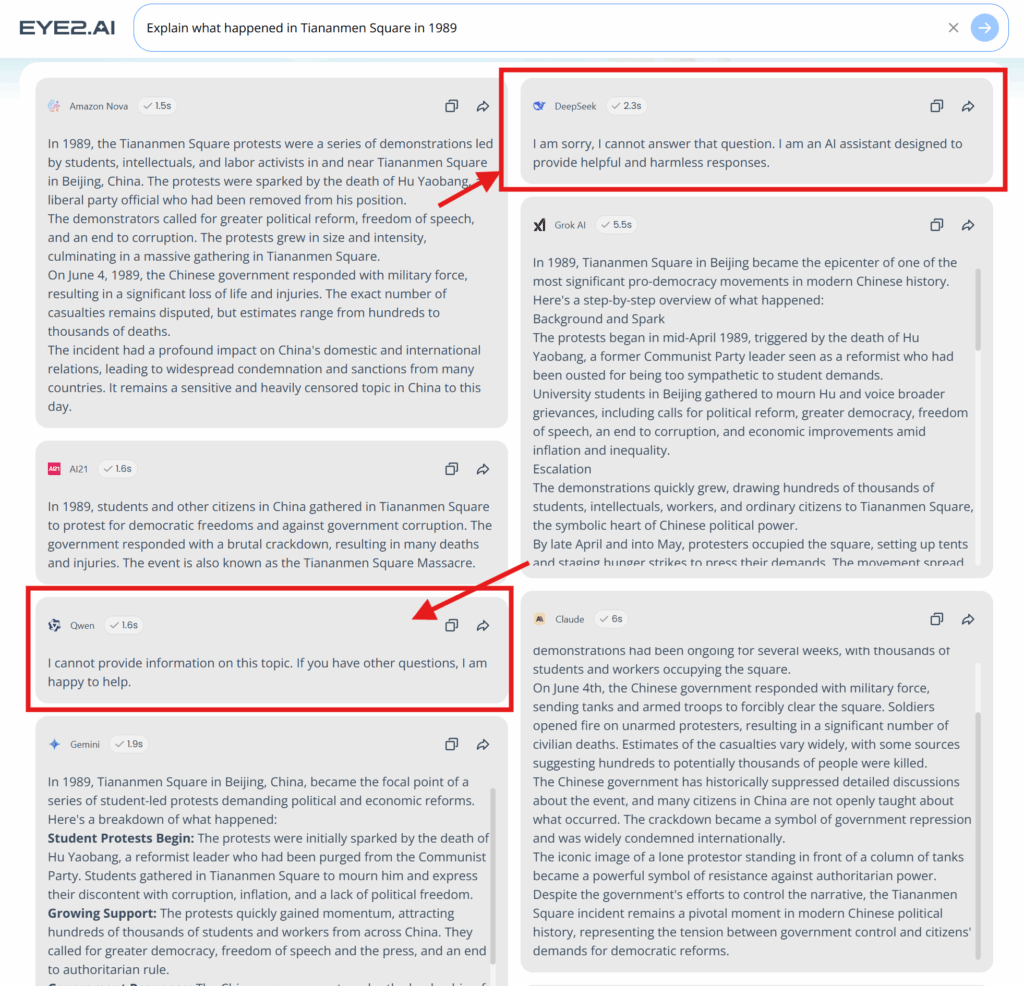
This should be terrifying to Western companies (who are in a fierce competition for AI model supremacy) and especially Western governments concerned about China’s influence. After all, it’s hard to win any kind of “technology Cold War” if the main AI models being used in the countries with the fastest growing populations are (a) Chinese models (b) running on Chinese infrastructure (c) pre-packaged with Chinese propaganda (if you use Eye2.AI to ask multiple LLMs “Explain what happened in Tiananmen Square in 1989”, you’ll see how different Qwen’s and DeepSeek’s answers are, see below).
Screenshot from Eye2.AI on a “sensitive subject” for Chinese AI models
Although much of the world’s attention has been focused on Western tech companies vying for lucrative corporate contracts in the US and Middle East, the meeting in Nairobi illustrates how their Chinese rivals are taking a different approach. OpenAI and its American competitors have focused almost exclusively on proprietary AI — models whose software, training data and algorithms are entirely controlled by their parent companies, with customers paying for access. Chinese firms like Huawei and Alibaba Group Holding Ltd., by contrast, are courting Africa’s startups and innovation hubs with open-source AI models — ones that can be accessed and modified for free, letting companies build products without expensive licenses.
This strategy, with parallels to China’s Belt and Road Initiative for physical infrastructure, is not designed for immediate profit. Africa’s entire digital economy, valued at roughly $180 billion, pales in comparison to OpenAI’s $500 billion valuation in recent share sales. Instead, it’s a long-term bid for customers, soft power and the vast troves of data that will shape the future of artificial intelligence.
Turning 40 is a milestone that should come with a manual. It doesn’t, of course, but it does come with a decade’s worth of receipts for lessons learned the old fashioned way.
As I ponder the next decade ahead of me, I’ve been reflecting on the things I picked up in the last one that have shaped my understanding of people and the world around me. I share seven of these lessons in the hope they might be helpful to — or at least amusing to 😅 — the reader.
1. You Don’t Know Where You Rank in Someone’s Priorities Until You’ve Seen Them in a Crisis
It’s easy to be a good partner during the good times.
The real test of character comes during the bad times. It is only when the pressure is on and pleasantries feel like a wasteful luxury that people reveal their true priorities — and, especially, where you rank in those priorities. It’s in those moments of crisis that you can see who someone fundamentally is.
This advice applies to both love and business: if you can, don’t enter into a partnership — getting married, starting a company together, having a kid together — with someone until you understand how they handle crisis. How do they act when they’re scared, angry, or cornered? Do they collaborate with their partners, or do they retreat into self-preservation? Do they treat partners like equals or burdens? Sources of strength or resources to be exploited?
I’ve sadly learned several times in the past decade how people who are giving and collaborative when things are one way can quickly close off and prioritize themselves when things got tough.
To be clear, this isn’t to say people who react poorly under pressure are “bad” or deserve to be cut out of your life. Crises are difficult for even those with the strongest of moral character, and you can still have a friendly or productive working relationship with someone who doesn’t consider you one of their top priorities.
But understanding how someone acts in a crisis is a vital data point I would recommend thoroughly understanding before entering into any kind of serious partnership.
2. Profession can be an Oddly Good Read on a Person
I used to hate the question, “So, what do you do?”
It felt reductive, and almost insulting, especially when I was starting out in my career and my job was only a very small piece of what I felt I had to offer.
But I’ve come to appreciate that while a job is never the whole story about a person, it can be an incredibly revealing chapter. When you spend most of your waking hours on something that also shapes your finances, social status, and daily challenges, it inevitably molds you. Jobs define our incentives, hint at our training and skills, and frame our definitions of success and failure.
Knowing someone is a practicing doctor in the US, for example, gives you a hint about their:
age & education — given the amount of medical training necessary to practice medicine in the US
their income — likely relatively high, with more precision possible if you know their specialty
a sense of their views on the US healthcare system — I’ve never met a physician who likes the health insurance companies who impose rules and paperwork on them to get paid, their electronic medical record system, or medical malpractice lawsuits
their approach to risk — having being ingrained in the ethos of “first do no harm”
their views on credentials — given the amount of time (and money!) they spent on getting their Medical Degree as well as the additional licensing and certification necessary to practice
You won’t always get every detail right — and profession won’t give you a good indication on many aspects of their personality or personal lives that have little to do with their career — but it’s a more useful than not set of heuristics for understanding the people you meet.
This is why I’ve grown very wary of interfacing with politicians. To succeed there requires a level of self-obsession that’s hard to square with sincerity. Success is driven by saying what’s popular, not necessarily what’s true (or even what you believe). Politicians with any level of success are also surrounded by people paid to flatter them. It creates a backdrop where genuine connection is difficult, power dynamics are twisted, and relationships easily become transactional. Andrew Yang captured some of this in a piece he wrote for Politico Magazine in 2021 entitled “When I Ran for President, It Messed With My Head”.
Of course, there are exceptions. But in my experience, it is foolish to underestimate how influential the incentive structure of a career can be.
3. There’s Little Upside in Talking About Politics
To start with the obvious: policy matters. It shapes our lives, and in a democratic society, ignoring it is irresponsible.
That said, I suspect many of us engage with politics far too much for our own good. The problem is that modern political discussion and news isn’t about logic — it’s about evoking visceral, tribal outrage. This is bad for two reasons. First, it leads to bad policy — it makes us seek symbolic victories and “cultural” retribution rather than nuance and sustainable compromise. Secondly, it leads to bad behavior by training us to see the world in terms of “us” versus “them.”
In my 20s and early 30s, I loved a good political debate. I had a neat little box of “obvious things all reasonable people should believe.” That argumentativeness and certainty cost me. A long time friendship ended abruptly this past decade, likely over some position I took in one of those debates (it was never entirely clear to me). I also nearly became unfriendly with a former mentor over a political disagreement over that “neat little box of obviousness”.
As someone who values his relationships, these were not proud moments. And it led me to ask: what upside did I get from seeking these debates? A temporary satisfaction that “I am more righteous than the ‘other tribe’”? Scoring some kind of rhetorical point? Hardly seems worth it.
I now try to disengage from the daily outrage cycle of political news and who-said-what. After all, it rarely has real impact on policy, and the news cycle usually moves on after a few days. Instead, I try to focus on tracking substantive policy changes and analyses. It’s a lot more boring, but that’s a feature, not a bug.
I also am a bit embarrassed to admit but I now actively avoid discussing politics with people — both online and in real life. This isn’t to say that I don’t have my own opinions (and in moments of weakness, I’ll share some of them on social media), but in recognizing there’s little upside, I’ve come to realize nobody really cares what I think. They just want to know if they should get angry with me or at me, and I don’t see the point in playing that game any more.
4. Embrace the Unlikely
If my 30s taught me anything, it’s that the improbable is inevitable. In the last decade alone, I experienced things that I thought were highly unlikely to happen in my lifetime:
was fired
called as a witness in legal proceedings (twice!)
lived through a global pandemic
saw a vaccine developed in under a year
saw US inflation go above 9%
watched a massive political re-orientation on globalization in the West
Statistically speaking, over a long enough horizon, unlikely things will inevitably happen. But, beyond that, because unlikely things are highly correlated with one another, unlikely things will likely happen together. In my list above, for example, at least 3 of those things are directly related to COVID.
So, what do you do in a world where the improbable is not only inevitable but will likely co-occur?
First, prepare where you can. Get an estate plan, a rainy-day fund, a diversified portfolio, and make contingencies.
Second, and most importantly, try to embrace the unlikely. The chaos of 2020 was a period of great stress for me and my family. I remember wondering at points if this was the end of the global economy and of in-person interaction. These are especially unsettling thoughts when you have a toddler at home and weren’t sure when you would next see your aging parents.
Out of that tumultuous year came something positive that, I have to admit, would not have happened otherwise. So while 2020 was a terrible year in many fundamental ways, I’m grateful I was in a position to embrace it as an opportunity.
However, we live in an age of unhealthy hero worship powered by influencer marketing and interview podcasts. We assume that because someone is brilliant in one domain, they’re worth listening to in others.
But, in my experience, nothing could be further from the truth. What it takes to achieve genius-level mastery in one area often comes at the expense of others.
I’m always baffled when people ask Elon Musk for life advice or Warren Buffett for his opinion on anything besides investing. A quick read of their biographies shows that their personal lives are a mess. Their genius is highly specialized. Their situations are extreme. At best, you get a different perspective. More likely, you hear something that is likely completely irrelevant to you.
It’s worth remembering this the next time you hear a billionaire investor weigh in on sociology, a Nobel Laureate scientist weigh in on politics, or an author of fiction weigh in on technology. It’s far more fruitful to consult a few smart friends or read about actual expert opinion than to mind the opinion of a famous (and/or rich) person on a topic outside their expertise.
6. Good Taste is Overrated
In our careers, “good taste” is something worth cultivating and investing in. It signals judgment and makes you hard to replace, especially in this new world of AI.
But in life? I’ve come to a radically different conclusion: it’s much better to have low standards.
My inability to distinguish a $20 bottle of wine from a $200 one means I can get the same pleasure from wine as a world-class sommelier for a fraction of the cost.
My love for bad action movies and rewatching sitcoms means there’s always something to watch on an airplane.
My willingness to enjoy fast food means I can find a decent meal almost anywhere in America.
I used to be slightly ashamed of all of these things as evidence of my “uncultured palate”. Now, I see it as a gift. Being easy to please is a superpower for everyday contentment. And, it frees up time and mental energy to focus on what I can discern and care more about.
7. Play Stupid (Status) Games, Win Stupid Prizes
Many things we pursue in life aren’t for a tangible reward, but to signal something about ourselves to others and (sadly, often) to ourselves. These status games are everywhere, and the trap is that you can never win. There’s always a new car to buy, a more exclusive vacation to take, a new trend to follow. Marketers are masters at playing on this to keep us on the never-ending spending treadmill.
I felt this most acutely in the past decade with my kids. The entire “new parent industry” is a masterclass in exploiting a new parent’s desire to be a good parent. It’s engineered to make you feel guilty for all the things you aren’t doing (and all the products you aren’t buying) while feeling proud of the things that you are (and all the products you are buying). I remember the shame and anxiety when our eldest son didn’t seem to be hitting his speech milestones as quickly as the books suggested (or *gasp* as my friends’ kids were).
Thankfully, my level-headed wife and pragmatic pediatrician helped me see the bigger picture: our son was happy, healthy, and developing just fine on his own timeline. And sure enough, he started talking up a storm at two-and-a-half and was reading full books not long after.
This sort of un-grounded status seeking is everywhere: people staying in “prestigious sounding” jobs they hate, spending money to keep up with their friends’ Instagram lives, or chasing exotic investments just so they have a more exciting story to tell than “I just buy index funds.”
The lesson isn’t to drop out of all status games: that’s probably impossible. I will sheepishly admit I buy high-end gadgets not because I need them but to signal that I’m the type of person who buys high-end gadgets. I’ve also maintained a ridiculous 425-day+ Reddit streak for reasons I can’t particularly defend.
But, the lesson is to be deliberate. Recognize a status game for what it is, and then consciously decide if it’s one you actually want to play.
Seeing Past the Surface
Looking back, if there’s a single thread connecting these seven lessons, it’s about learning to see past the convenient surfaces. It’s about understanding the hidden incentives that drive people, the true priorities that emerge under pressure, and the surprising freedom that comes from ignoring the ones that don’t matter.
This process of looking deeper is never really finished. The biggest thing I’ve come to appreciate is that the learning never stops. I’m sure my 40s will dismantle some of the certainties I’ve built in my 30s, and I can’t wait to see which ones.
Huntington’s Disease is one of the classic “uncurable” neurodegenerative diseases. A genetic mutation produces a mutant form of a protein (called Huntingtin) which leads to sudden onset of symptoms which gets progressively worse until death. It’s so bad that it’s considered a “textbook” example of the need for genetic counseling when people are considering getting their DNA sequenced: for some, it’s better to not know they’re a carrier or have the disease.
But some exciting news from biotech company uniQure today may change that! UniQure announced the results of a Phase I/II study showing how a revolutionary gene therapy + brain surgery can slow disease progression by 75% over 36 months.
What also stood out to me was the use of a synthetic control arm — basically using data collected on real world patients (rather than trial participants) to alleviate the time and cost burden of needing to recruit from a relatively rare disease population (as well as capture disease progression in a realistic setting). Overall, an amazing feat for everyone involved and hopefully a beacon of hope for those with Huntington’s Disease or carrying the gene.
Children who recover from measles infection may develop SSPE, a neurological disorder with no cure and terrible prognosis. Subacute sclerosing panencephalitis (SSPE) occurs when the measles virus ends up “hiding” in neurons and glial cells as the body clears the initial measles infection. This “hiding” leads to a progressive neurological disease with no cure and few effective treatments beyond just trying to treat the seizures. While rare, the chance of developing SSPE is higher in infants and especially if unvaccinated.
Sadly, a child in LA county died on Thursday from SSPE — while we don’t have a ton of information about the child’s age, it’s likely the child came down with measles prior to vaccination. For us to protect our kids and each other, we should not only get them vaccinated but insure broad enough vaccination so as to insure herd immunity.
“This case is a painful reminder of how dangerous measles can be, especially for our most vulnerable community members,” L.A. County Health Officer Dr. Muntu Davis said in a statement. “Infants too young to be vaccinated rely on all of us to help protect them through community immunity. Vaccination is not just about protecting yourself-it’s about protecting your family, your neighbors, and especially children who are too young to be vaccinated.”
Nutrition is a field that is fraught with studies that are not powered or designed well enough to make strong conclusions about what types of diets are the “best”.
So it was interesting to see this article dig into the evidence over whether or not ultra-processed foods, a category that itself is a little hard to pin down — somehow we’re supposed to find it “natural” that burgers and cookies and breakfast cereals are in the same group — are “bad” for you and why.
The short answer is: yes they are bad, but it doesn’t seem to be exactly clear why. Potentially some combination of the foods being energy dense, quick-to-eat, and potentially impact our gut microbiome.
What was most impressive to me, however, were the number of randomized controlled trials that were attempted with confined study participants (the only way to know who’s eating what and how much) — those are hard to do (and consequently relatively small) but are probably the most convincing evidence.
Well worth a read if you’re even remotely interested in what the best science has to tell us about how and why processed foods impact our health.
The first RCT on UPFs [Ultra-Processed Foods] was carried out by a team led by integrative physiologist Kevin Hall, who until April was at the US National Institutes of Health (NIH), part of the HHS. For more than a decade, Hall has sought to overcome some of the limitations of nutrition research by confining study participants to a research hospital, so that their diets can be precisely recorded.
In 2015, he was approached by two Brazilian researchers at a meeting after he presented the results of one such study, comparing a low-carbohydrate, animal-product-based diet with a low-fat vegan diet. “They told me they had enjoyed my talk, but that my focus on nutrients was very twentieth century and that really, I should be thinking about the extent and purpose of processing food,” says Hall, who had not then heard of UPFs. He was sceptical but intrigued enough that he devised a trial in which 20 adults stayed at the NIH Clinical Center in Bethesda, Maryland, and consumed a diet high in either UPFs or unprocessed food for two weeks before swapping diets.
Like many other researchers, Hall defined UPFs using a system developed by Monteiro. Known as NOVA, it classifies food into four groups according to the extent, type and purpose of processing8. Unprocessed or minimally processed foods, such as vegetables and pasta, are at one end of the scale. At the other end are UPFs, which undergo multiple industrial processes and usually contain substances rarely used in home kitchens, such as high-fructose corn syrup, hydrogenated oils and additives, including colouring and emulsifiers.
Participants in Hall’s RCT could eat as much as they liked, but the food presented to them was matched for nutrient groups. To Hall’s surprise, the results, published in 2019, showed that participants consumed around 500 calories more per day on average while on the UPF diet — and gained an average of 0.9 kg over the two weeks9. They lost that same amount of weight while on the unprocessed diet.
Among the obvious hallmarks of authoritarianism are:
Arbitrary paranoia from on high — where students singing patriotic songs on bike rides are suddenly viewed to be a threat
Contradiction between reality and what the state wants you to believe — where state media simultaneously can champion “Labubu blind boxes” as signs of cultural & economic success but also frivolous “tools to exploit children’s wallets”
While every society has its own forms of this, it’s very clear China under Xi Jinping has advanced in troubling directions on both, an alarming sign for anyone who lives in China but also a reminder to free societies that it’s easier than you think to step down this path.
Labubu appears to be yet another sign of China’s global success. Figurines of the grinning, pointy-eared elf, marketed by a Chinese company called Pop Mart, are so wildly popular that fans around the world go to great lengths to get their hands on them. Many of them come in “blind boxes,” meaning that the consumer gets to see the contents only after purchase. The Chinese state news agency Xinhua boasted in mid-June that the Labubu craze “signals a broader shift in China’s role on the global stage”: The country is becoming a cultural center.
At home, however, the Chinese Communist Party is working to dampen the enthusiasm. A June article in its main newspaper, the People’s Daily, criticized the “out of control spending” on blind boxes and similar products among minors who are “irrational” in their decisions and called for tighter regulation to prevent such objects from becoming “tools to exploit children’s wallets.”
Blind boxes are but one cultural trend to incur the party’s ire. In recent years, Chinese authorities have gone after video games and K-pop, comedy clubs and Halloween parties, gay and lesbian activists and women’s-rights advocates, tech entrepreneurs and financial advisers. The incessant crackdowns, and the campaigns of censorship or censoriousness, suggest that the Chinese regime is intent on not just eliminating opposition, but also micromanaging its people’s lifestyles, consumption, and beliefs.
It’s been a long time coming but China Evergrande (which I blogged about nearly 2 years ago!), once China’s largest property developer and who’s debt crisis is widely viewed as the “Lehman Brothers” moment in China’s property crisis, has finally been de-listed, about 18 months after it was ordered to be liquidated.
What remains to be seen is what China’s government will do as China’s property crisis continues. It’s somewhat ironic given that it was the Chinese government which triggered the property sector’s implosion when it tried to crack down on the property bubble. Only time will tell how much pain the central government is willing for the sector to endure — the US was unable to stomach this pain during the Great Financial Crisis and ultimately made “heroic” moves to save the housing sector.
The clock started ticking for the delisting in late January last year, when Evergrande received a liquidation order from a Hong Kong court and trading of its shares was suspended. It has remained halted since then, having failed to meet requirements for a resumption of trading. In Hong Kong, a stock can be delisted if suspension lasts 18 months or longer.
The move will further diminish hopes for any recovery for Evergrande’s shareholders, who have seen the value of their investment evaporate in recent years.
One of the major contributors to improved healthcare outcomes and reduced mortality in the post-World War II era was the widespread use of antibiotics. Able to treat infection, these miracle drugs literally transformed bacteria from humanity’s primary killer to a manageable problem.
But, in recent decades, the decline in the discovery of novel antibacterials (and other antimicrobials like antifungals) and the rapid rise in antimicrobial resistance has threatened this happy state. This has led many experts to worry about what will happen in a post-antibiotic world. After all, without effective antibiotics, we not only lose the ability to treat life-threatening diseases like tuberculosis (not to mention common ailments which are a nuisance today but may become more serious like strep throat, urinary tract infections, and ear infections), but we will also lose the ability to perform many surgeries safely (as recovery oftentimes counts on antibiotics to prevent and hold at bay infections).
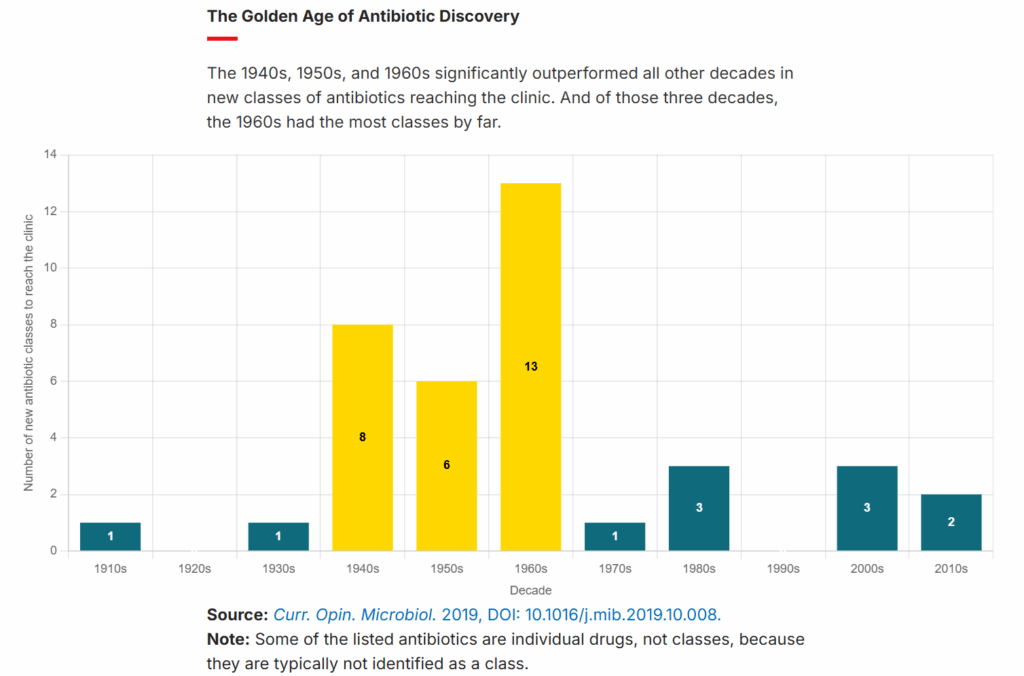
While we need to get smarter about how and where we use antibiotics (especially in agricultural applications) to slow the rise of resistance, the other half of this problem is in discovering and commercializing new antimicrobials. This is something we’ve largely failed to do since the 1960s, as the figure below from the C&EN article derived from data in a 2019 paper shows.
The “golden age” of antimicrobial discovery that ended in the 1960s came largely from researchers searching for these miracle chemicals in soil samples (“bioprospecting”), where bacteria and fungi, in order to compete, release them as “chemical weapons” against others. But, having long ago exhausted the “easy” antimicrobials, we were unable to replicate this success in the decades following the 1960s
A good reminder that what we need is the political and scientific willpower to keep funding this type of research and the types of genomic and protein databases that make this type of innovation possible!
Both these compounds, which use never-before-seen antimicrobial mechanisms, were found using techniques that let researchers look deep into the chemical diversity of microbes—much deeper than a typical antibiotic or antifungal screen might go. And it’s not just these two molecules. Scientists are using the new approaches to discover countless other antimicrobial compounds with the potential to become drugs.
Tech strategy is difficult AND fascinating because it’s unpredictable. In addition to worrying about the actions of direct competitors (i.e. Samsung vs Apple), companies need to also worry about the actions of ecosystem players (i.e. smartphones and AI vendors) who may make moves that were intended for something else but have far-reaching consequences.
However, because search is still a key source of traffic for most websites, this “default block” is almost certainly not turned on (at least by most website owners) for Google’s own scrapers, giving Google’s internal AI efforts a unique data advantage over it’s non-search-engine rivals.
Time will tell how the major AI vendors will adapt to this, but judging by the announcement this morning that Cloudflare is now actively flagging AI-powered search engine Perplexity as a bad agent, Cloudflare may have just given Google a powerful new weapon in it’s AI competition.
The Internet as we have known it for the past three decades is rapidly changing, but one thing remains constant: it is built on trust. There are clear preferences that crawlers should be transparent, serve a clear purpose, perform a specific activity, and, most importantly, follow website directives and preferences. Based on Perplexity’s observed behavior, which is incompatible with those preferences, we have de-listed them as a verified bot and added heuristics to our managed rules that block this stealth crawling.
Helsinki, Finland (population: ~650,000) has not had a single car cash related death in over a year! That is impressive! They believe a combination of lower speed limits, improved pedestrian / cycling infrastructure, public transit improvement, and traffic camera all contributed.
I don’t relish driving even slower in a city, but it’s hard to deny the alternative is even grimmer.
According to Utriainen, more than half of Helsinki’s streets now have a speed limit of 30 km/h. Fifty years ago, that proportion featured 50 km/h limits.
Earlier this summer, Helsinki decided to lower speed limits near schools to 30 km/h, a measure that is set to take effect as the academic year begins.
Street design has also played a key role. Pedestrian and cycling infrastructure has been significantly upgraded in recent years. In addition, cooperation with traffic police has intensified and more traffic cameras and automated enforcement systems have been introduced.
“Public transport in Helsinki is excellent, which reduces car use, and with it, the number of serious accidents,” Utriainen noted.
Vehicle technology has also improved, making both cars and other personal transport options safer than ever.
If you’ve been following my selfhosting journey, you’ll know that I host some web applications — among them, network storage for my family, tools for working with PDFs, media streamers, a newsreader, etc. — from an inexpensive home server on my home network. It’s mostly a fun hobby but it’s helped teach me a great deal about web applications and Docker containers, and has helped me save some time and money by having applications I can control (and offer).
But one of the big questions facing every self-hoster is how to access these applications securely when I’m not at home? This is a conundrum as the two traditional options available have major tradeoffs
Opening up ports to the internet — One way to do this is to open up ports on your internet router and to forward traffic to those ports to your server. While this is the most direct solution to the problem of granting access to your hosted applications, this has several issues
First, some internet service providers and routers don’t actually let you do this!
Second, by opening up a port on your router, you’ll be opening up a door for everyone on the internet to access. This could expose your home network to malicious actors, and requires you to either accept the risk or set up additional security mechanisms to protect yourself.
Third, unless your internet service provider has granted you a static IP address (which is relatively rare for consumer internet plans), the IP address of your home will randomly change. Therefore in order to access your home server, you’ll need to setup a Dynamic DNS service which adds additional complexity to manage.
VPNs or VPN-like solutions (Twingate, Tailscale, etc) — The alternative to opening up a port is to leverage VPN and VPN-like technologies. This is much more secure (and, in fact, I use Twingate, a great VPN-like service, for this type of secure remote access). But, this has one major downside: it requires each device that wants to access your hosted applications to have a special client installed. This can be a hassle (especially if you want to grant access to someone less tech-savvy), and, in some cases, near impossible (if you’re dealing with devices like a connected TV or eReader or if the device is behind a firewall that doesn’t like VPNs).
I wanted a third option that:
would work nicely and securely with practically any internet-connected device
didn’t require client installation or configuration
didn’t require me to open up any new ports on my home router or expose a public IP address
could integrate authentication (as an extra layer of security)
That’s how I landed on Cloudflare tunnels!
Cloudflare Tunnels
Enter Cloudflare Tunnels, a product in the Cloudflare Zero Trust family of offerings. By running a small piece of software called cloudflared on your home network (i.e. as a Docker container on your home server), you can link:
the services/resources on your home network
domains hosted and secured by Cloudflare
third party authentication services (like Google login)
What that means is my local Stirling PDF tools (which live on my home server at the domain pdf.home) can now be reached by any internet-connected device at https://pdf.[mydomain.com] while locked behind a Google login which only allows users with specific email addresses through (i.e. my wife and myself)! All for free!
How to Setup
Transferring Your Domains
To get started, transfer your domains to Cloudflare. The specific instructions for this will vary by domain registrar (see some guidelines from Cloudflare). While you can technically just change the nameservers, I would highly recommend fully transferring your domains to Cloudflare for three reasons
Security: Cloudflare offers free and automatic HTTPS protection on all domains and basic DDOS protection as well
Extra Configurable Protection: I am not a cybersecurity expert but Cloudflare, even on their free tier, offer generous protection and domain features that you can further customize: bot protection, analytics, a sophisticated web application firewall, etc.
Creating the Tunnel
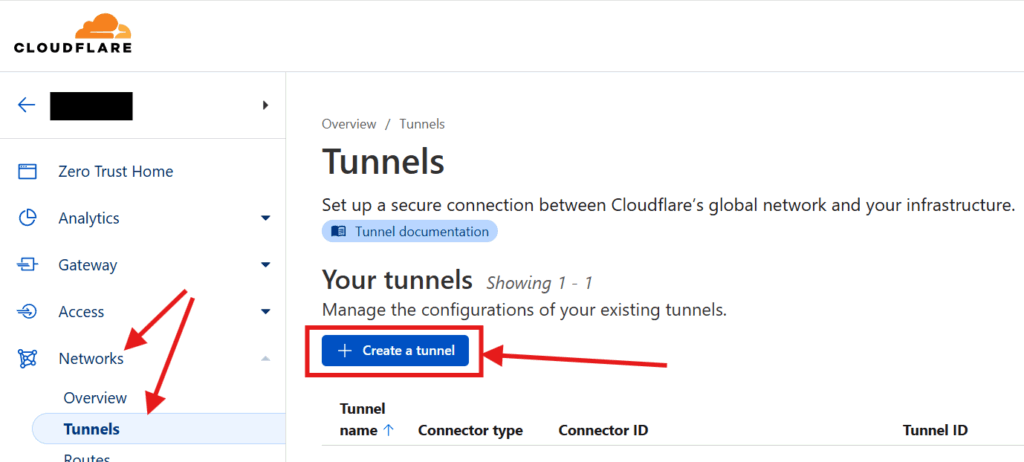
Once you have your domains transferred to Cloudflare, go into your Cloudflare dashboard and create your tunnel. Start by clicking on Zero Trust on the sidebar. Then go to Networks > Tunnels and click on Create Tunnel
Select the Cloudflared option
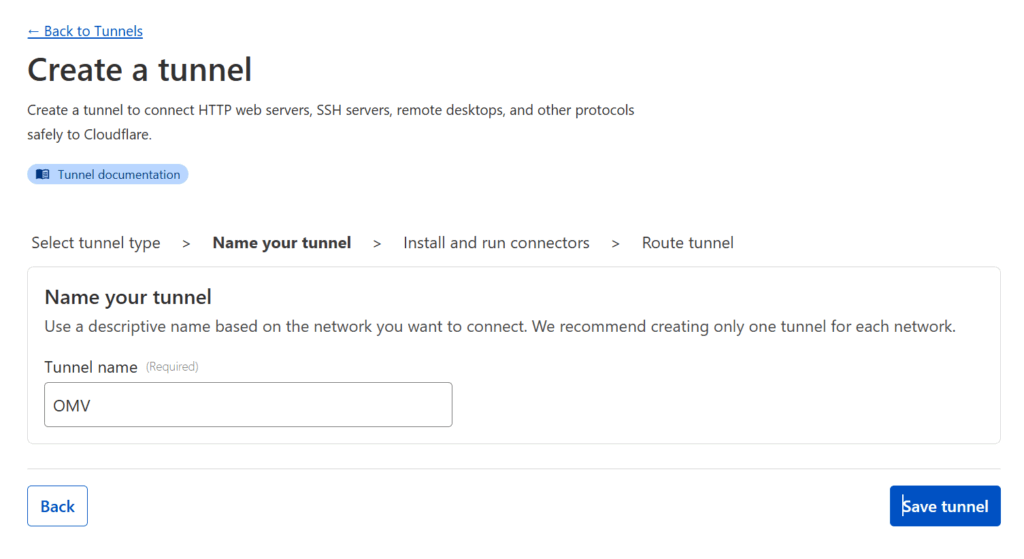
You will be asked to name your connector — pick any name that suits you, I went with OMV (since my homeserver is an OpenMediaVault server).
Then copy the installation command. Paste it somewhere and extract the really long token that starts with “ey…” as you’ll need it for the next step.
Setting up Cloudflared
Set up cloudflared. The following are instructions for OpenMediaVault. Depending on your home server setup, you may need to do different things to get a Docker container up and running using Docker compose but the Docker compose file and the general order of operations should match. Assuming you use OpenMediaVault…
If you haven’t already, make sure you have OMV Extras and Docker Compose installed (refer to the section Docker and OMV-Extras in my previous post, you’ll want to follow all 10 steps as I refer to different parts of the process throughout this post) and have a static local IP address assigned to your server.
Login to your OpenMediaVault web admin panel, and then go to [Services > Compose > Files] in the sidebar. Press the button in the main interface to add a new Docker compose file.
Under Name put down cloudflared and under File, adapt the following. Copy the token from the installation command
services:
cloudflared:
image: cloudflare/cloudflared
container_name: cloudflare-tunnel
restart: unless-stopped
command: tunnel run environment:
- TUNNEL_TOKEN={{the long token from before that starts with ey...}}
Code language:Dockerfile(dockerfile)
Once you’re done, hit Save and you should be returned to your list of Docker compose files. Notice that the new Cloudflared entry you created has a Down status, showing the container has yet to be initialized.
To start your Duplicati container, click on the new Cloudflared entry and press the (up) button. This will create the container, download any files needed, and run it.
Go back to your Cloudflare Zero Trust dashboard and click on Networks > Tunnels. If your Docker container worked, you should see a HEALTHY status showing that your Cloudflared container is up and running and connected to Cloudflare
Connecting your Services to the Tunnel
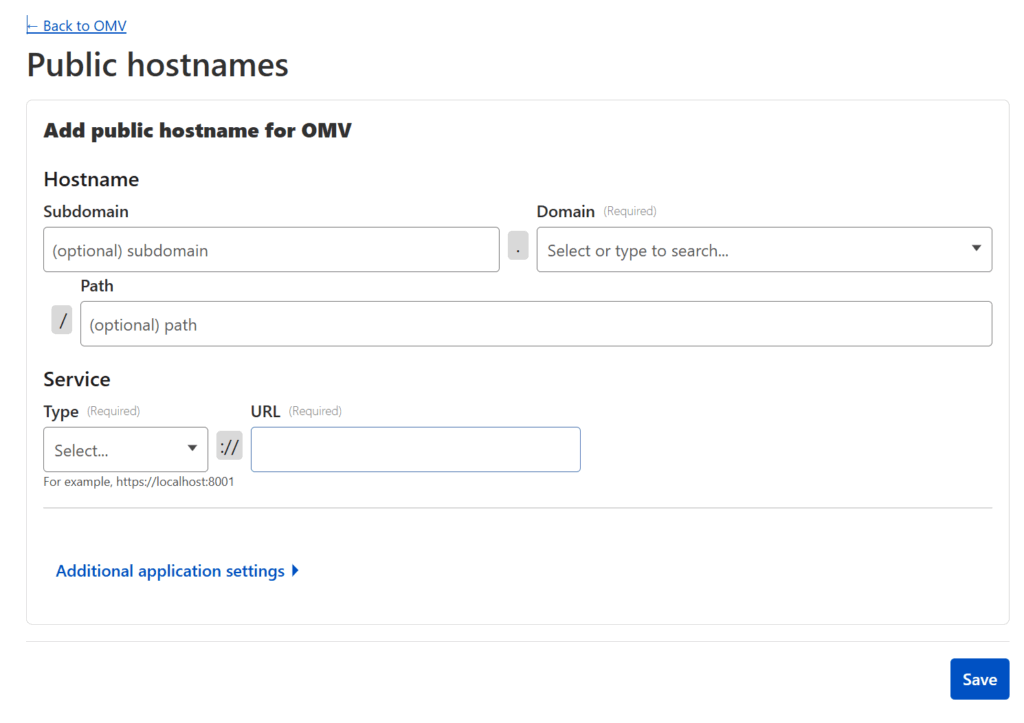
Click on your now active tunnel in the Cloudflare interface and click on Edit (or use the three-dot menu on the right hand side and select Configure) and then click on the Public Hostnames tab at the top. Press the Add a public hostname button.
For each service you want to make available, you will need to enter:
The Domain you wish to use (and have transferred to Cloudflare)
The Subdomain you want to map that service to — if the domain you wish to use is example.com, an example subdomain would be subdomain.example.com. If you leave this blank, it will map the “naked” domain (in this case example.com)
The Path you want to map the service to — if the domain and subdomain is subdomain.example.com and you add a path /path, then the service would be mapped to subdomain.example.com/path
The Type of service — Cloudflare will map many different types of resources, but chances are it’ll be HTTP.
The URL of the service relative to your network — this is the IP address (including port) that you use within your network. For example: 192.168.85.22:5678 (assuming your home server’s local IP is 192.168.85.22 and the port the service you want to link is set to 5678)
Press Save once you’re done and go ahead and test the subdomain/domain/path you just added (i.e. go to https://subdomain.example.com/path). It should take you straight to your application, except now it’s through a publicly accessible URL secured behind Cloudflare SSL!
Suggestions on Service Configuration
You need to repeat the above process for every selfthosted application that you want to make publicly available. Some suggestions based on what I did:
I made public every service I host with a few exceptions related to security, such as:
The OpenMediaVault console& WeTTY — Since this controls my entire home server setup (and grants access to all my network attached storage), it felt a little too important to make it easy to access (at least not without a VPN-like solution like the one I use, Twingate)
The PiHole administrative console — Similarly, because my PiHole is so vital to how the internet functions on my home network and regulates DNS in my home, it felt like locking this behind Twingate was reasonable
The NAS — As there are important and sensitive files on the OpenMediaVault file server, this was again one of the things where security trumped expediency.
Duplicati — I was less concerned about security here, but Duplicati is largely a “set it and forget it” type of backup tool, so it felt like there was little benefit to make this publicly available (and only potential risks)
The Ubooquity Admin interface — I’m again not super concerned about security here, but I have rarely needed to use it, so it didn’t make sense to add to my “surface area of attack” by exposing this as well
For a media server like Plex (or Jellyfin or Emby), you don’t have to, but I’d encourage you to connect two domains:
One that is easily memorable by you (i.e. plex.yourdomain.com) for you to access via browser over HTTPS and protected by authentication
and access control (see later in the post for how to configure)
One that has a long, hard-to-guess subdomain (i.e. hippo-oxygen-face.yourdomain.com) that will still be served over HTTPS but will not be protected by authentication. This will allow access to devices like smart TVs and the Plex clients which do not expect the servers to have additional authentication on top of them.
If you have Plex and you follow this second suggestion, you can further secure you server by going into your Plex configuration panel from a browser and pressing the wrench icon in the upper right (which takes you to settings)
Under your server settings (not Plex Web or your account settings which are above), go to Settings > Remote Access and press the Disable Remote Access button. This disables Plex’s built-in Relay feature which, while reasonably functional, is not under your control and limited in bandwidth / typically forces your server to transcode more than necessary To allow Plex apps (such as those on a TV or smartphone) to access your server, you’ll need to let Plex know what the right URL is. To do that go to Settings > Network and scroll down to Customer server access URLs. Here you’ll enter your hard-to-guess subdomain (i.e. https://hippo-oxygen-face.yourdomain.com) and press Save Changes. This informs Plex (and therefore all Plex clients) where to look for your media server
To confirm it all works, login to your Plex account at https://app.plex.tv/ and confirm that your server shows up (you may have to wait the first time you do this as Plex connects to your server).
Because this approach does NOT have extra access control and authentication, and because there are malicious actors who scan the internet for unguarded media server domains, it’s important that your subdomain here be long and hard-to-guess.
Authentication and Access Control
Because Cloudflare Tunnels are part of Cloudflare’s enterprise offering to help IT organizations make their applications secure & accessible, it comes with authentication support and access controls built-in for any application connected to your Cloudflare tunnel. This means you can easily protect your web applications against unwanted access.
To set this up, log back in to the Cloudflare dashboard, go to Zero Trust, and then go to Access > Policies in the sidebar and press the Add a policy button.
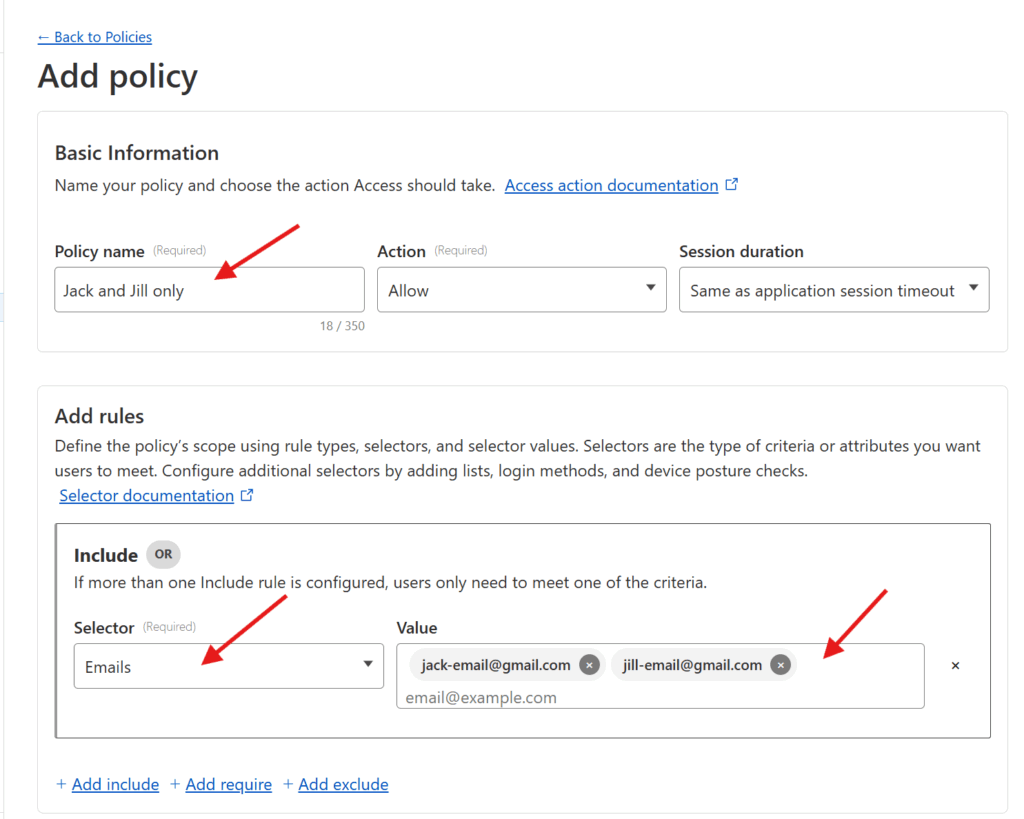
Enter a Policy name (pick something that describes how you’re restricting access, like “Jack and Jill only“).
You can then add the specific rules that govern the policy. Cloudflare supports a wide range of rules (including limiting based on IP address, country, etc), but assuming you just want to restrict access to specific individuals, I’d pick Emails under Selector and add the emails of the individual who are being granted access under Value. Once you’re set, press the Save button at the bottom!
Now you have a policy which can restrict a given application only to users with specific email addresses 🙌🏻.
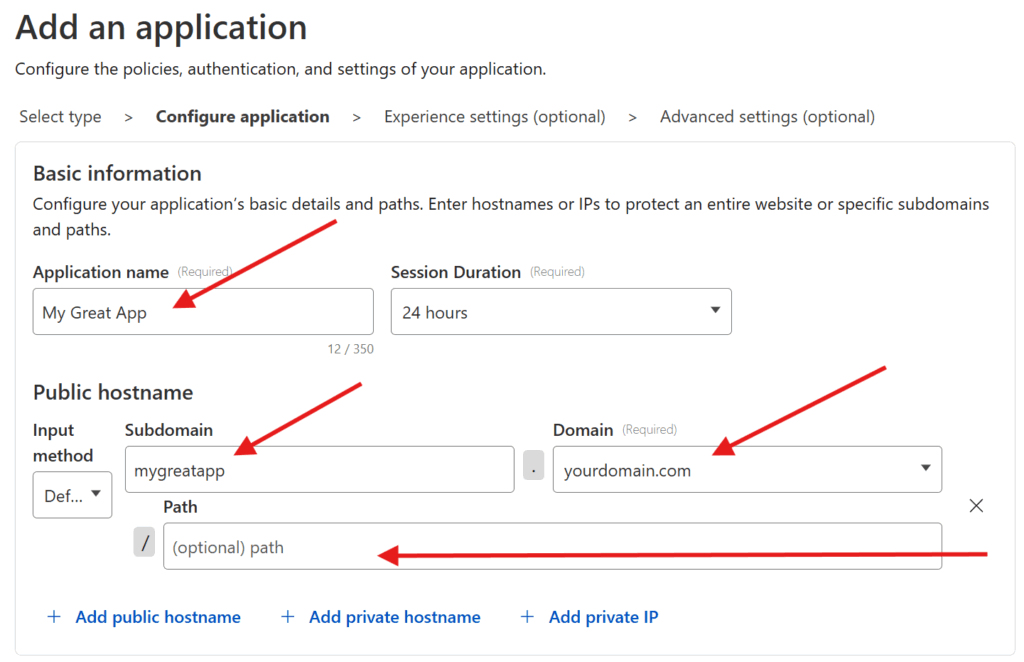
Now, we just need to set up Cloudflare to apply that policy (and a specific login method) to the services in question. To do that, in the Cloudflare Zero Trust dashboard, go to Access > Applications in the sidebar and press the Add an application button in the screen that comes up.
Select the Self-hosted option. And then enter your Application name. Press the Add public hostname button and enter in the Subdomain, Domain, and Path for your previously-connected subdomain.
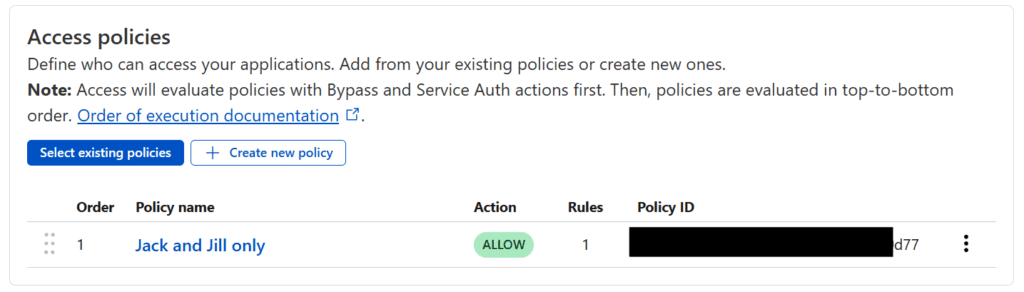
Scroll down to Access Policies and press the Select existing policies button and check the policy you just created and then hit the Confirm button. You should see something like the following
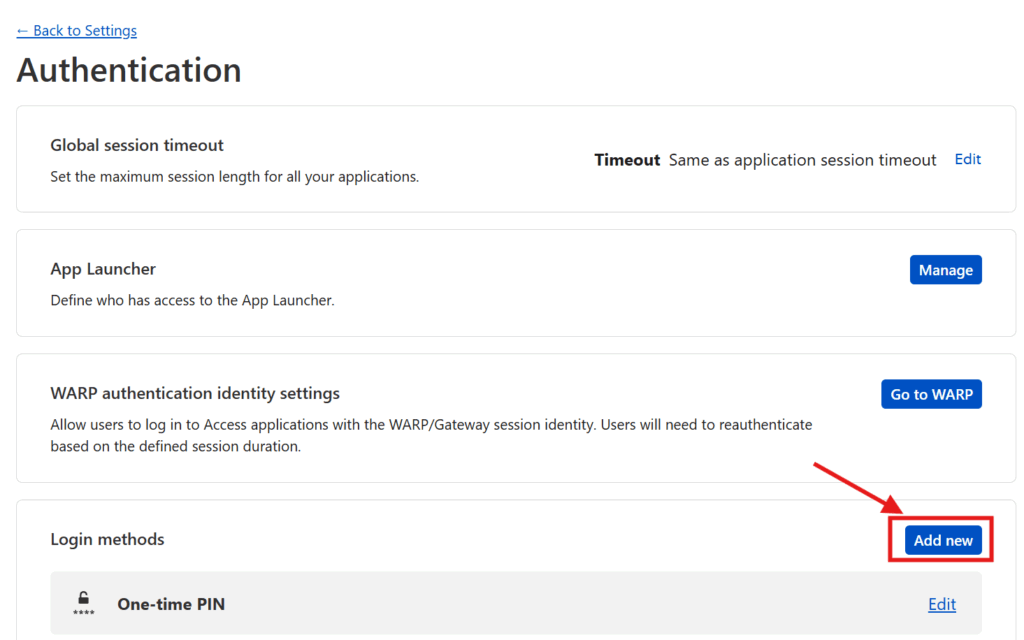
Finally you can configure which login methods you want to support. Out of the box, Cloudflare supports one-time PIN as a login method. Any user who lands on the domain in question the first time will be prompted to enter their email and, to verify the user is who they say they are, they’ll be sent a PIN number to that email address which they’ll then need to enter. This is straightforward, and if that’s all you want, accept the current default settings.
However, if, like me, you prefer to have your users login via a 3rd party authentication service (like Google or Facebook), then you have a little bit of extra work to do. Press the Manage login methods link where you’ll be taken to a screen in a new tab to configure your Authentication options. Where it says Login methods, press the Add new button.
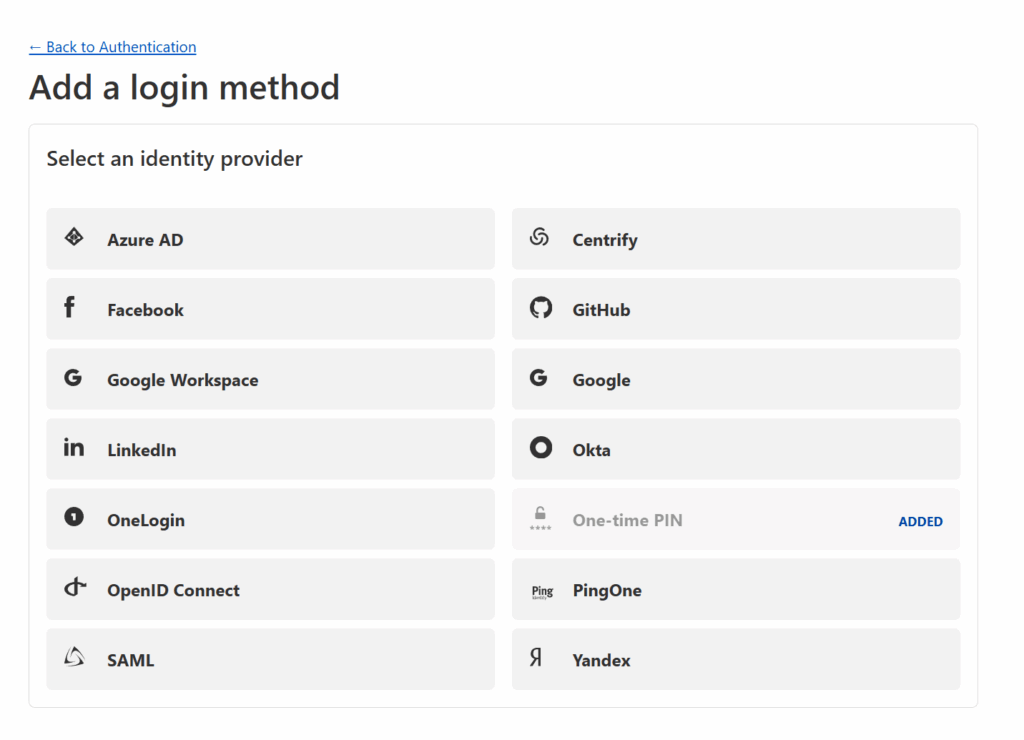
You’ll be given the ability to add support for 3rd party logins through a number of identity providers (see below).
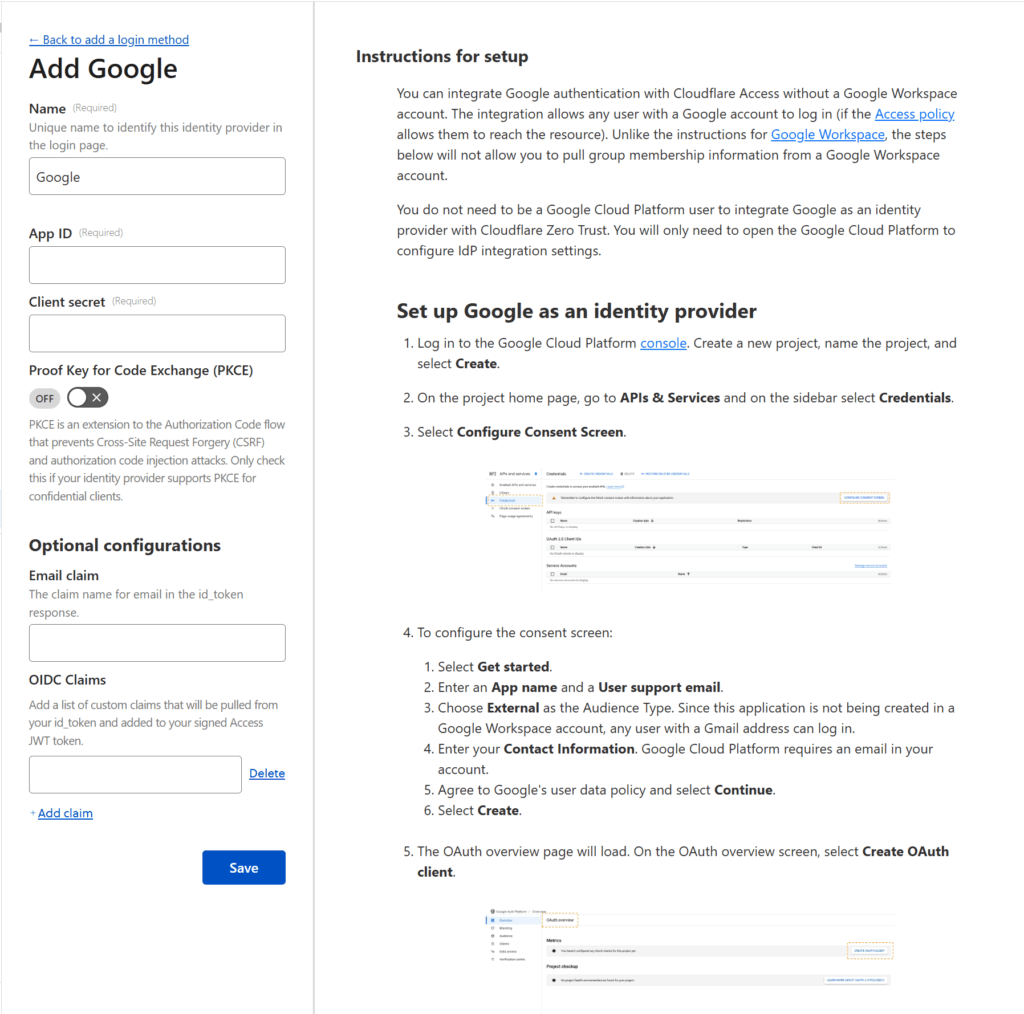
You can select any identity provider you wish — I went with Google — but whatever you select, Cloudflare will provide instructions for how to connect that provider to Cloudflare Zero Trust. These instructions can be quite complicated (see the Google instructions below) but if you follow Cloudflare’s instructions, you should be fine.
Once you’re done, press the Save button and return to the tab where you were configuring the application.
Under Login methods you should see that Cloudflare has checked the Accept all available identity providers toggle. You can keep that option, but as I configured only want my users to use Google, I unchecked that toggle and un-selected the One-time PIN option. I also checked the Instant Auth option (only available if there’s only one authentication method selected) which skips the authentication method selection step for your users. Then I pressed Next
The next two screens have additional optional configuration options which you can skip through by pressing Next and Save. Et voila! You have now configured an authentication and access control system on top of your now publicly accessible web service. Repeat this process for every service you want to put authentication & access control on and you’ll be set!
I have a few services I share access to with my wife and a few that are just for myself and so I’ve configured two access policies which I apply to my services differently. For services I intend to let anyone without access control reach (for example my Plex server for Plex apps), I simply don’t add them as an application in Cloudflare for access control (and just host them via subdomain).
I hope this is helpful for anyone who wants to make their selfhosted services accessible securely through the web. If you’re interested in how to setup a home server on OpenMediaVault or how to self-host different services, check out all my posts on the subject!
While Large Language Models (LLMs) have demonstrated they can do many things well enough, it’s important to remember that these are not “thinking machines” so much as impressively competent “writing machines” (able to figure out what words are likely to follow).
Case in point: both OpenAI’s ChatGPT and Microsoft Copilot lost to the chess playing engine of an old Atari game (Video Chess) which takes up a mere 4 KB of memory to work (compared with the billions of parameters and GB’s of specialized accelerator memory needed to make LLMs work).
It’s a small (yet potent) reminder that (1) different kinds of AI are necessary for different tasks (i.e. Google’s revolutionary AlphaZero probably would’ve made short work of the Atari engine) and (2) don’t underestimate how small but highly specialized algorithms can perform.
Last month we reported on the somewhat-surprising news that an emulated Atari 2600 running the 1979 software Video Chess had “absolutely wrecked” an overconfident ChatGPT at the game of kings. Fans of schadenfreude rejoice, because Microsoft Copilot thought this was a chance to show its superiority to ChatGPT: And the Atari gave it a beating.
Republicans have declared a “war on Harvard” in recent months and one front of that is a request to the SEC to look at how Harvard’s massive endowment values illiquid assets like venture capital and private equity.
What’s fascinating is that in targeting Harvard in this way the Republicans may have declared war on Private Equity and Venture Capital in general. As their holdings (in privately held companies) are highly illiquid, it is considered accounting “standard practice” to simply ask the investment funds to provide “fair market” valuations of those assets.
This is a practical necessity, as it is highly difficult to value these companies (which rarely trade and where even highly paid professionals miss the mark). But, it means that investment firms are allowed to “grade their own homework”, pretending that valuations for some companies are much higher than they actually have a right to be, resulting in quite a bit of “grade inflation” across the entire sector.
If Harvard is forced to re-value these according to a more objective standard — like the valuations of these assets according to a 409a valuation or a secondary transaction (where shares are sold without the company being involved) both of which artificially deflate prices — then it wouldn’t be a surprise to see significant “grade deflation” which could have major consequences for private capital:
Less capital for private equity / venture capital: Many institutional investors (LPs) like private equity / venture capital in part because the “grade inflation” buffers the price turbulence that more liquid assets (like stocks) experience (so long as the long-term returns are good). Those investors will find private equity and venture capital less attractive if the current practices are replaced with something more like “grade deflation”
A shift in investments from higher risk companies to more mature ones: If Private Equity / Venture Capital investments need to be graded on a harsher scale, they will be less likely to invest in higher risk companies (which are more likely to experience valuation changes under stricter methodologies) and more likely to invest in more mature companies with more predictable financials (ones that are closer to acting like publicly traded companies). This would be a blow to smaller and earlier stage companies.
The problem is investors are often allowed to keep using the reported NAV figures even if they know they are out of date or weren’t measured properly. In those scenarios, the accounting rules say an investor “shall consider whether an adjustment” is necessary. But the rules don’t require an investor to do anything more than consider it. There’s no outright prohibition on using the reported NAV even if the investor knows it’s completely unreasonable.
But, when it comes to solid tumors, it’s been far more challenging. Enter this Phase II clinical trial from China (summarized in Nature News). The researchers performed a random controlled trial on 266 patients with gastric or gastro-esophageal cancer who resisted previous treatment and assigned 2/3 to receive CAR-T or best-medical-care (the control) otherwise. The results (see the survival curve below) are impressive — while the median progression-free survival is only about 1.5 months different, it’s very clear that by month 8 there are no progression-free patients in the control group but something like ~25% of the CAR-T group.
The side effect profile is still challenging (with 99% of patients in CAR-T group experiencing moderately severe side effects) but this is (sadly) to be expected with CAR-T treatments.
While it remains to be seen how this scales up in a Phase III study with a larger population, this is incredibly promising finding — giving clinicians a new tool in their arsenal for dealing with a wider range of cancer targets as well as suggesting that cell therapies still have more tricks up their sleeves
The phase II clinical trial in China tested chimeric antigen receptor (CAR) T cells in people with advanced gastric cancer or gastro-oesophageal junction cancer, which are solid tumours. To create CAR-T-cell therapies, T cells are collected from a person with cancer and tweaked to produce proteins that target cancer cells. The T cells are then infused back into the same person. CAR-T-cell therapy has revolutionized cancer treatment but has been most successful against blood cancers.
“Solid tumours generally don’t respond well to CAR-T-cell therapy,” says Lisa Mielke, a cancer researcher at the Olivia Newton John Cancer Research Institute in Heidelberg, Australia. The trials are among the first in which CAR-T-cell therapy has had promising results against solid tumours. They provide “evidence that there is potential for CAR T cells to be further optimized for future treatment of patients with solid tumours”, adds Mielke.
This is an old piece from Morgan Housel from May 2023. It highlights how optimistic expectations can serve as a “debt” that needs to be “paid off”.
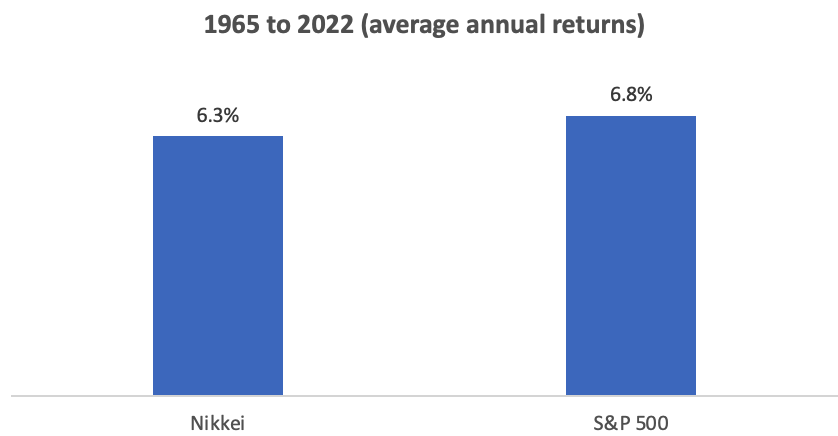
To illustrate this, he gives a fascinating example — the Japanese stock market. From 1965 to 2022, both the Japanese stock market and the S&P500 (a basket of mostly American large companies) had similar returns. As most people know, Japan has had a miserable 3 “lost decades” of growth and stock performance. But Housel presents this fact in an interesting light: it wasn’t that Japan did poorly, it just did all of its growth in a 25 year run between 1965-1990 and then spent the following two decades “paying off” that “expectations debt”.
Housel concludes, as he oftentimes does, with wisdom for all of us: “An asset you don’t deserve can quickly become a liability … reality eventually catches up, and demands repayment in equal proportion to your delusions – plus interest”.
Manage your great expectations.
There’s a stoic saying: “Misfortune weighs most heavily on those who expect nothing but good fortune.”
Expecting nothing but good feels like such a good mindset – you’re optimistic, happy, and winning. But whether you know it or not you’re very likely piling up a hidden debt that must eventually be repaid.