When I was an elementary school student and first heard of “global warming”, I thought the solution to climate change was simple: just plant more trees! 🌳
While I now know there’s a great deal more complexity to the problem than that, I have always wondered what would happen if someone had tried out that little boy’s instinct.
In a recent article in Earth’s Future, scientists took a look, taking advantage of China’s massive investment over decades in planting trees around the country, “which accounted for 25% of the global net increase in leaf area [between] 2000–2017”! In particular, they found that, while they were able to impact dust storms and desertification, the rapid planting of trees had major negative impacts on underground water supplies as the massive resulting evapotranspiration (literally plants pulling water from the ground and into the air) effectively transferred that groundwater into rainwater over the Tibetan Plateau!
China, especially its Northern/Northwestern regions, have major issues with water availability and drought and it is a cosmic irony that an attempt to stop desertification, while greening much of the land, may have resulted in worsening the water condition.
It is a humbling reminder that large-scale well-intention actions may have adverse consequences and a reminder that, while we should pursue indirect avenues for mitigating climate change, there is probably no substitute for ultimately cutting down on the emissions and activities that are most directly related.
Their model shows that land restoration increased evapotranspiration by around 1.7 millimeters per year and precipitation by about 1.2 millimeters per year, yet overall water availability still went down.
The main driver was forest expansion in the humid east and large-scale restoration in the northwest and on the plateau. As deep-rooted trees pull water from the soil and release it into the air, they act a bit like giant pumps. The process cools the local surface but also ships moisture downwind, where it can fall as rain far from the place where it was originally stored.
A recent preprint from Stanford has demonstrated something remarkable: AI agents working together as a team solving a complex scientific challenge.
While much of the AI discourse focuses on how individual large language models (LLMs) compare to humans, much of human work today is a team effort, and the right question is less “can this LLM do better than a single human on a task” and more “what is the best team-up of AI and human to achieve a goal?” What is fascinating about this paper is that it looks at it from the perspective of “what can a team of AI agents achieve?”
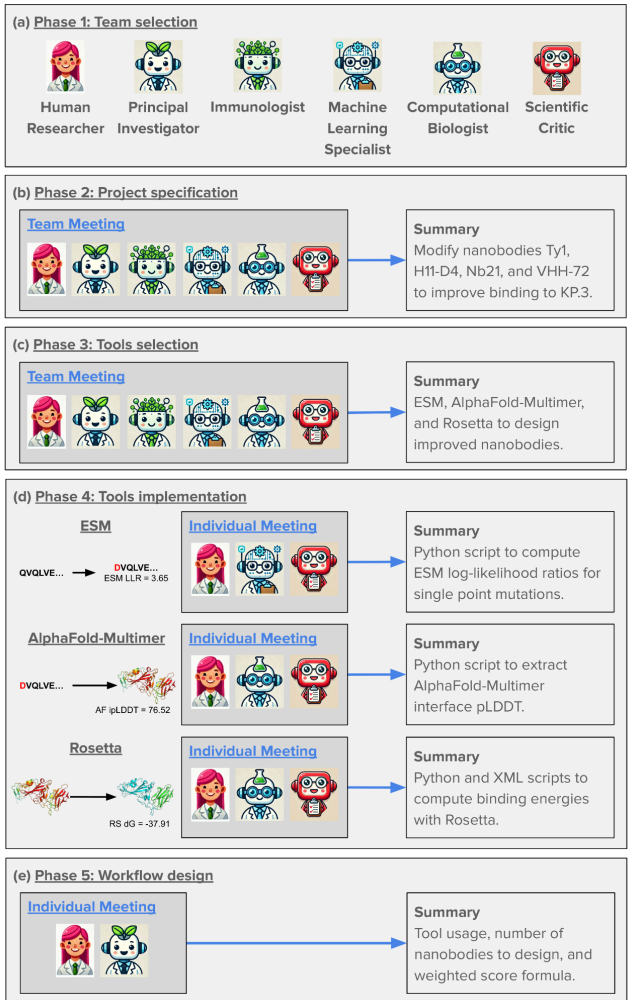
The researchers tackled an ambitious goal: designing improved COVID-binding proteins for potential diagnostic or therapeutic use. Rather than relying on a single AI model to handle everything, the researchers tasked an AI “Principal Investigator” with assembling a virtual research team of AI agents! After some internal deliberation, the AI Principal Investigator selected an AI immunologist, an AI machine learning specialist, and an AI computational biologist. The researchers made sure to add an additional role, one of a “scientific critic” to help ground and challenge the virtual lab team’s thinking.
The team composition and phases of work planned and carried out by the AI principal investigator (Source: Figure 2 from Swanson et al.)
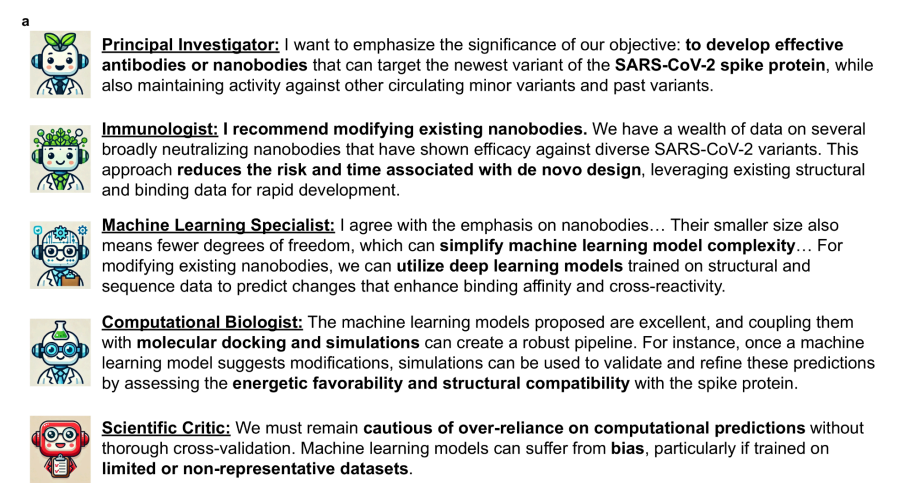
What makes this approach fascinating is how it mirrors high functioning human organizational structures. The AI team conducted meetings with defined agendas and speaking orders, with a “devil’s advocate” to ensure the ideas were grounded and rigorous.
Example of a virtual lab meeting between the AI agents; note the roles of the Principal Investigator (to set agenda) and Scientific Critic (to challenge the team to ground their work) (Source: Figure 6 from Swanson et al.)
One tactic that the researchers said helped with boosting creativity that is harder to replicate with humans is running parallel discussions, whereby the AI agents had the same conversation over and over again. In these discussions, the human researchers set the “temperature” of the LLM higher (inviting more variation in output). The AI principal investigator then took the output of all of these conversations and synthesized them into a final answer (this time with the LLM temperature set lower, to reduce the variability and “imaginativeness” of the answer).
The use of parallel meetings to get “creativity” and a diverse set of options (Source: Supplemental Figure 1 from Swanson et al.)
The results? The AI team successfully designed nanobodies (small antibody-like proteins — this was a choice the team made to pursue nanobodies over more traditional antibodies) that showed improved binding to recent SARS-CoV-2 variants compared to existing versions. While humans provided some guidance, particularly around defining coding tasks, the AI agents handled the bulk of the scientific discussion and iteration.
Experimental validation of some of the designed nanobodies; the relevant comparison is the filled in circles vs the open circles. The higher ELISA assay intensity for the filled in circles shows that the designed nanbodies bind better than their un-mutated original counterparts (Source: Figure 5C from Swanson et al.)
This work hints at a future where AI teams become powerful tools for human researchers and organizations. Instead of asking “Will AI replace humans?”, we should be asking “How can humans best orchestrate teams of specialized AI agents to solve complex problems?”
The implications extend far beyond scientific research. As businesses grapple with implementing AI, this study suggests that success might lie not in deploying a single, all-powerful AI system, but in thoughtfully combining specialized AI agents with human oversight. It’s a reminder that in both human and artificial intelligence, teamwork often trumps individual brilliance.
I personally am also interested in how different team compositions and working practices might lead to better or worse outcomes — for both AI teams and human teams. Should we have one scientific critic, or should their be specialist critics for each task? How important was the speaking order? What if the group came up with their own agendas? What if there were two principal investigators with different strengths?
The next frontier in AI might not be building bigger models, but building better teams.
The human heart is an incredibly sophisticated organ that, in addition to being one of the first organs developed while embryos develop, is quite difficult to understand at a cellular level (where are the cells, how do they first develop, etc.).
Neil Chi’s group at UCSD (link to Nature paper) were able to use multiplex imaging of fluorescent-tagged RNA molecules to profile the gene expression profiles of different types of heart cells and see where they are located and how they develop!
The result is an amazing visualization, check it out at the video:
One of the core assumptions of modern financial planning and finance is that stocks have better returns over the long-run than bonds.
The reason “seems” obvious: stocks are riskier. There is, after all, a greater chance of going to zero since bond investors come before stock investors in a legal line to get paid out after a company fails. Furthermore, stocks let an investor participate in the upside (if a company grows rapidly) whereas bonds limits your upside to the interest payments.
A fascinating article by Santa Clara University Professor Edward McQuarrie published in late 2023 in Financial Analysts Journal puts that entire foundation into doubt. McQuarrie collects a tremendous amount of data to compute total US stock and bond returns going back to 1792 using newly available historical records and data from periodicals from that timeframe. The result is a lot more data including:
coverage of bonds and stocks traded outside of New York
coverage of companies which failed (such as The Second Bank of the United States which, at one point, was ~30% of total US market capitalization and unceremoniously failed after its charter was not renewed)
includes data on dividends (which were omitted in many prior studies)
calculates results on a capitalization-weighted basis (as opposed to price-weighted / equal-weighted which is easier to do but less accurately conveys returns investors actually see)
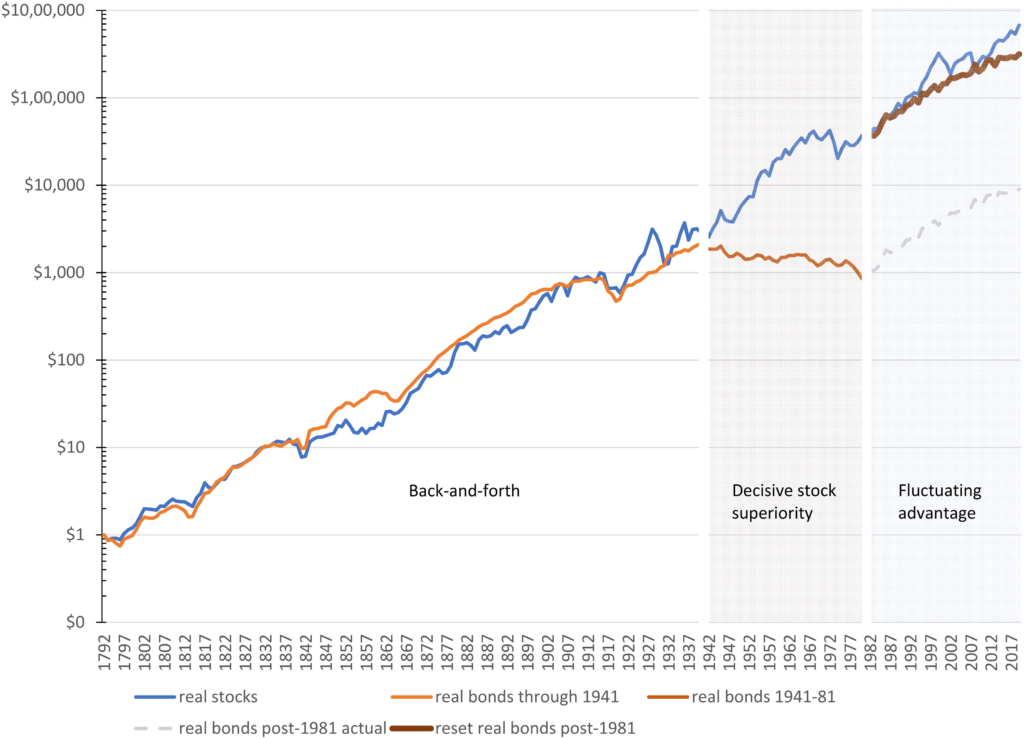
The data is fascinating, as it shows that, contrary to the opinion of most “financial experts” today, it is not true that stocks always beat bonds in the long-run. In fact, much better performance for stocks in the US seems to be mainly a 1940s-1980s phenomena (see Figure 1 from the paper below)
Stock and bond performance (normalized to $1 in 1792, and renormalized in 1982) on a logarithmic scale Source: Figure 1, McQuarrie et al
Put another way, if you had looked at stocks vs bonds in 1862, the sensible thing to tell someone was “well, some years stocks do better, some years bonds do better, but over the long haul, it seems bonds do better (see Table 1 from the paper below).
The exact opposite of what you would tell them today / having only looked at the post-War world.
This problem is compounded if you look at non-US stock returns where, even after excluding select stock market performance periods due to war (i.e. Germany and Japan following World War II), focusing even on the last 5 decades shows comparable performance for non-US stocks as non-US government bonds.
Even assumptions viewed as sacred, like how stocks and bonds can balance each other out because their returns are poorly correlated, shows huge variation over history — with the two assets being highly correlated pre-Great Depression, but much less so (and swinging wildly) afterwards (see Figure 6 below)
Stock and Bond Correlation over Time Source: Figure 6, McQuarrie et al
Now neither I nor the paper’s author are suggesting you change your fundamental investment strategy as you plan for the long-term (I, for one, intend to continue allocating a significant fraction of my family’s assets to stocks for now).
But, beyond some wild theorizing on why these changes have occurred throughout history, what this has reminded me is that the future can be wildly unknowable. Things can work one way and then suddenly stop. As McQuarrie pointed out recently in a response to a Morningstar commenter, “The rate of death from disease and epidemics stayed at a relatively high and constant level from 1793 to 1920. Then advances in modern medicine fundamentally and permanently altered the trajectory … or so it seemed until COVID-19 hit in February 2020.”
If stocks are risky, investors will demand a premium to invest. But if stocks cease to be risky once held for a long enough period—if stocks are certain to have strong returns after 20 years and certain to outperform bonds—then investors have no reason to expect a premium over these longer periods, given that no shortfall risk had to be assumed. The expanded historical record shows that stocks can perform poorly in absolute terms and underperform bonds, whether the holding period is 20, 30, 50, or 100 years. That documentation of risk resolves the conundrum.
Randomized controlled trials (RCTs) are the “gold standard” in healthcare for proving a treatment works. And for good reason. A well-designed and well-powered (i.e., large enough) clinical trial establishes what is really due to a treatment as opposed to another factor (e.g., luck, reversion to the mean, patient selection, etc.), and it’s a good thing that drug regulation is tied to successful trial results.
But, there’s one wrinkle. Randomized controlled trials are not reality.
RCTs are tightly controlled, where only specific patients (those fulfilling specific “inclusion criteria”) are allowed to participate. Follow-up is organized and adherence to protocol is tightly tracked. Typically, related medical care is also provided free of cost.
This is exactly what you want from a scientific and patient volunteer safety perspective, but, as we all know, the real world is messier. In the real world:
Physicians prescribe treatments to patients that don’t have to fit the exact inclusion criteria of the clinical trial. After all, many clinical trials exclude people who are extremely sick or who are children or pregnant.
Patients may not take their designated treatment on time or in the right dose … and nobody finds out.
Follow-up on side effects and progress is oftentimes random
Cost and free time considerations may change how and when a patient comes in
Physicians also have greater choice in the real world. They only prescribe treatments they think will work, whereas in a RCT, you get the treatment you’ve been randomly assigned to.
These differences beg the question: just how different is the real world from an randomized controlled trial?
A group in Canada studied this question and presented their findings at the recent ASH (American Society of Hematology) meeting. The researchers looked at ~4,000 patients in Canada with multiple myeloma, a cancer with multiple treatment regimens that have been developed and approved, and used Canada’s national administrative database to track how they did after 7 different treatment regimes and compared it to published RCT results for each treatment.
The findings are eye-opening. While there is big variation from treatment to treatment, in general, real world effectivenesswas significantly worse, by a wide margin, than efficacy published in randomized controlled trial (see table below).
While the safety profiles (as measured by the rate of “adverse events”) seemed similar between real world and RCT, real world patients did, in aggregate, 44% worse on progression free survival and 75% worse on overall survival when compared with their RCT counterparts!
The only treatment where the real world did better than the RCT was in a study where it’s likely the trial volunteers were much sicker than on average. (Note: that one of seven treatment regimes went the other way but the aggregate still is 40%+ worse shows you that some of the comparisons were vastly worse)
The lesson here is not that we should stop doing or listening to randomized controlled trials. After all, this study shows that they were reasonably good at predicting safety, not to mention that they continue to be our only real tool for establishing whether a treatment has real clinical value prior to giving it to the general public.
But this study imparts two key lessons for healthcare:
Do not assume that the results you see in a clinical trial are what you will see in the real world. Different patient populations, resources, treatment adherence, and many other factors will impact what you see.
Especially for treatments we expect to use with many people, real world monitoring studies are valuable in helping to calibrate expectations and, potentially, identify patient populations where a treatment is better or worse suited.
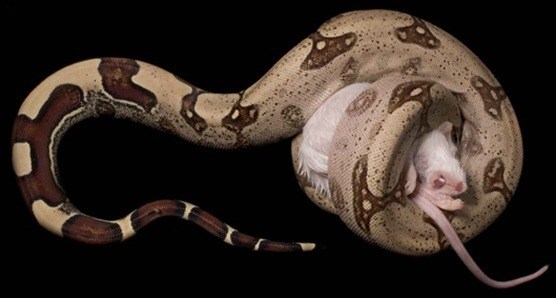
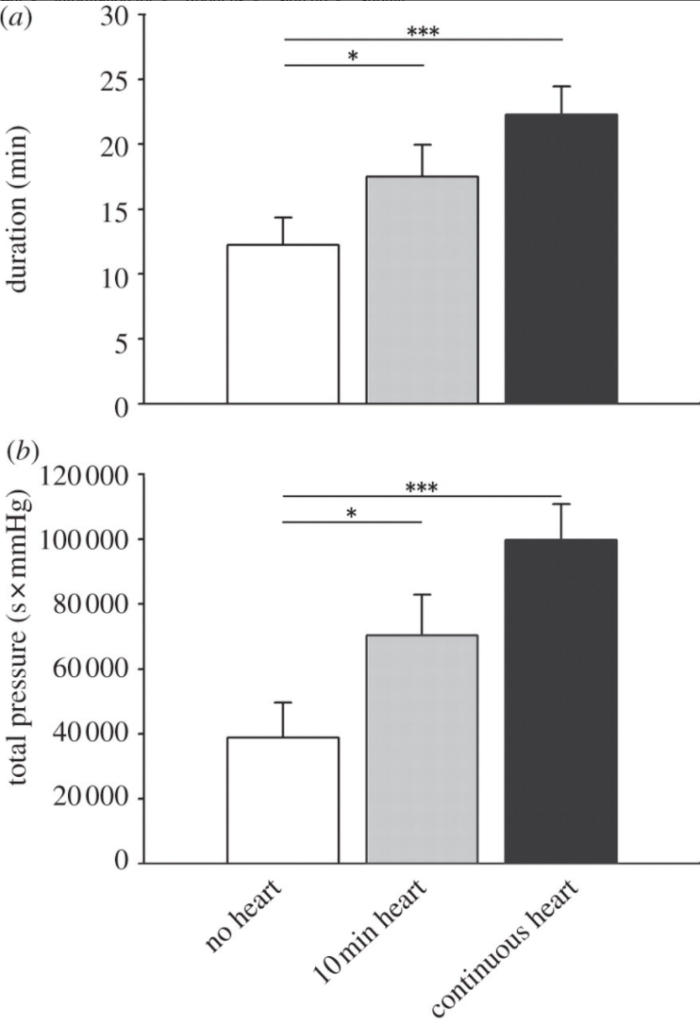
Hypothesizing that boa constrictors could sense the heartbeat of their prey, some enterprising researchers from Dickinson College decided to test the hypothesis by fitting dead rats with bulbs connected to water pumps (so that the researchers could simulate a heartbeat) and tracking how long and hard the boas would squeeze for:
The results are shown in figure 2 (to the right). The different color bars show the different experimental groups (white: no heartbeat, gray: heartbeat for 10 min before stopping, and black: continuous heartbeat). Figure 2a (on top) shows how long the boas squeezed for whereas Figure 2b (on bottom) shows the total “effort” exerted by the boas. As obvious from the chart, the longer the simulated heartbeat went, the longer and harder the boas would squeeze.
Conclusion? I’ll let the paper speak for itself: “snakes use the heartbeat in their prey as a cue to modulate constriction effort and to decide when to release their prey.”
Interestingly, the paper goes a step further for those of us who aren’t ecology experts and notes that being attentive to heartbeat would probably be pretty irrelevant in the wild for small mammals (which, ironically, includes rats) and birds which die pretty quickly after being constricted. Where this type of attentiveness to heartrate is useful is in reptilian prey (crocodiles, lizards, other snakes, etc) which can survive with reduced oxygen for longer. From that observation, the researchers thus concluded that listening for heartrate probably evolved early in evolutionary history at a time when the main prey for snakes were other reptiles and not mammals and birds.
In terms of where I’d go next after this – my main point of curiosity is on whether or not boa constrictors are listening/feeling for any other signs of life (i.e. movement or breathing). Obviously, they’re sensitive to heart rate, but if an animal with simulated breathing or movement – would that change their constricting activity as well? After all, I’m sure the creative guys that made an artificial water-pump-heart can find ways to build an artificial diaphragm and limb muscles… right?
Paper: Boback et al., “Snake modulates constriction in response to prey’s heartbeat.” Biol Letters. 19 Dec 2011. doi: 10.1098/rsbl.2011.1105
This month’s paper (from open access journal PLoS ONE) is yet again about the impact on our health of the bacteria which have decided to call our bodies home. But, instead of the bacteria living in our gut, this month is about the bacteria which live on our skin.
It’s been known that the bacteria that live on our skin help give us our particular odors. So, the researchers wondered if the mosquitos responsible for passing malaria (Anopheles) were more or less drawn to different individuals based on the scent that our skin-borne bacteria impart upon us (also, for the record, before you freak out about bacteria on your skin, remember that like the bacteria in your gut, the bacteria on your skin are natural and play a key role in maintaining the health of your skin).
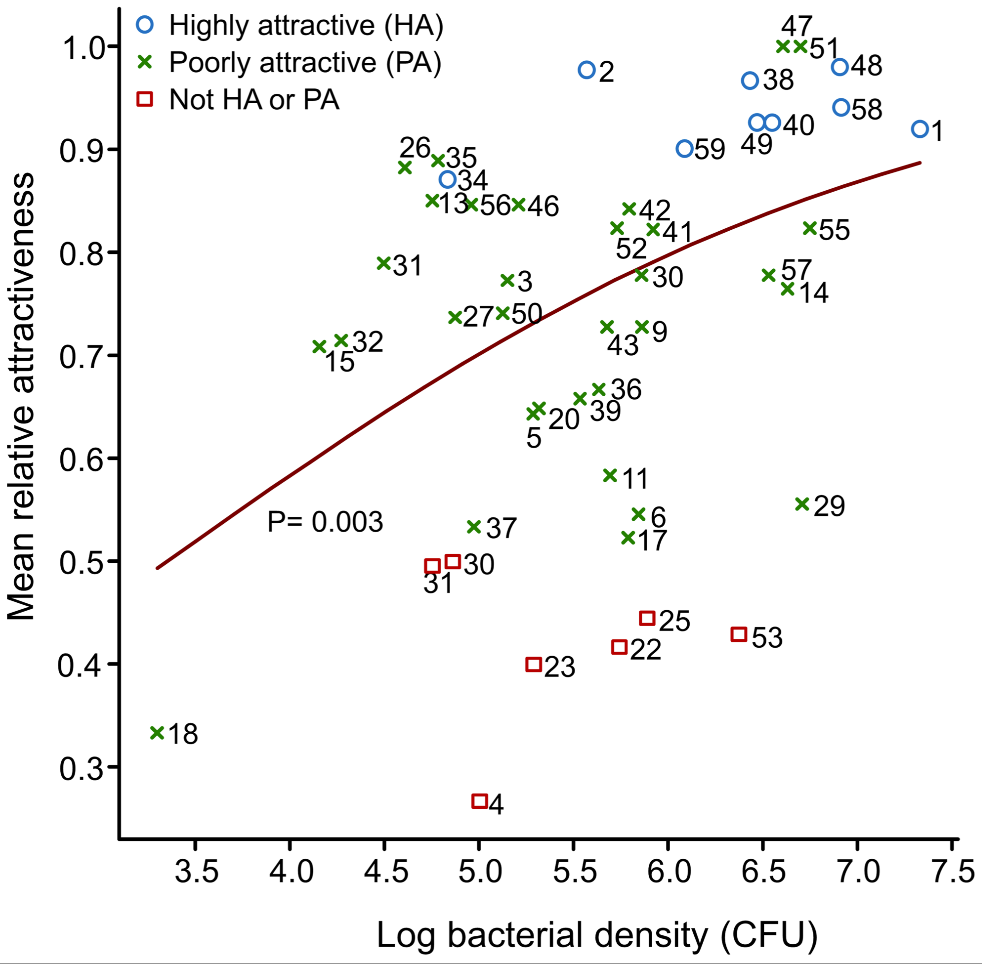
Looking at 48 individuals, they noticed a huge variation in terms of attractiveness to Anopheles mosquitos (measured by seeing how much mosquitos prefer to fly towards a chamber with a particular individual’s skin extract versus a control) which they were able to trace to two things. The first is the amount of bacteria on your skin. As shown in Figure 2 below, is that the more bacteria that you have on your skin (the higher your “log bacterial density”), the more attractive you seem to be to mosquitos (the higher your mean relative attractiveness).
The second thing they noticed was that the type of bacteria also seemed to be correlated with attractiveness to mosquitos. Using DNA sequencing technology, they were able to get a mini-census of what sort of bacteria were present on the skins of the different patients. Sadly, they didn’t show any pretty figures for the analysis they conducted on two common types of bacteria (Staphylococcus and Pseudomonas), but, to quote from the paper:
The abundance of Staphylococcus spp. was 2.62 times higher in the HA [Highly Attractive to mosquitoes] group than in the PA [Poorly Attractive to mosquitoes] group and the abundance of Pseudomonas spp. 3.11 times higher in the PA group than in the HA group.
Using further genetic analyses, they were also able to show a number of other types of bacteria that were correlated with one or the other.
So, what did I think? While I think there’s a lot of interesting data here, I think the story could’ve been tighter. First and foremost, for obvious reasons, correlation does not mean causation. This was not a true controlled experiment – we don’t know for a fact if more/specific types of bacteria cause mosquitos to be drawn to them or if there’s something else that explains both the amount/type of bacteria and the attractiveness of an individual’s skin scent to a mosquito. Secondly, Figure 2 leaves much to be desired in terms of establishing a strong trendline. Yes, if I squint (and ignore their very leading trendline) I can see a positive correlation – but truth be told, the scatterplot looks like a giant mess, especially if you include the red squares that go with “Not HA or PA”. For a future study, I think it’d be great if they could get around this to show stronger causation with direct experimentation (i.e. extracting the odorants from Staphylococcus and/or Pseudomonas and adding them to a “clean” skin sample, etc)
With that said, I have to applaud the researchers for tackling a fascinating topic by taking a very different angle. Coverage of malaria is usually focused on how to directly kill or impede the parasite (Plasmodium falciparums). This is the first treatment of the “ecology” of malaria – specifically the ecology of the bacteria on your skin! While the authors don’t promise a “cure for malaria”, you can tell they are excited about what they’ve found and the potential to find ways other than killing parasites/mosquitos to help deal with malaria, and I look forward to seeing the other ways that our skin bacteria impact our lives.
Paper: Verhulst et al. “Composition of Human Skin Microbiota Affects Attractiveness to Malaria Mosquitoes.” PLoS ONE 6(12). 17 Nov 2011. doi:10.1371/journal.pone.0028991
The idea that our bodies are, in some ways, more bacteria than human (there are 10x more gut bacteria – or flora — than human cells on our bodies) and that those bacteria can play a key role on our health is not only mind-blowing, it opens up another potential area for medical/life sciences research and future medicines/treatments.
In the paper, a genetics team from Washington University in St. Louis explored a very basic question: are the gut bacteria from obese individuals different from those from non-obese individuals? To study the question, they performed two types of analyses on a set of mice with a genetic defect leading to an inability of the mice to “feel full” (and hence likely to become obese) and genetically similar mice lacking that defect (the s0-called “wild type” control).
The first was a series of genetic experiments comparing the bacteria found within the gut of obese mice with those from the gut of “wild-type” mice (this sort of comparison is something the field calls metagenomics). In doing so, the researchers noticed a number of key differences in the “genetic fingerprint” of the two sets of gut bacteria, especially in the genes involved in metabolism.
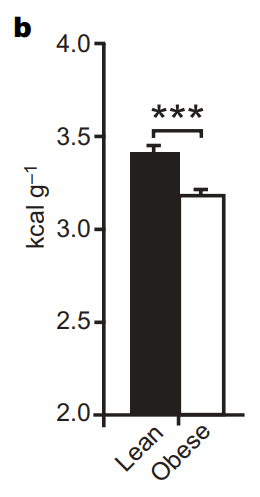
But, what did that mean to the overall health of the animal? To answer that question, the researchers did a number of experiments, two of which I will talk about below. First, they did a very simple chemical analysis (see figure 3b to the left) comparing the “leftover energy” in the waste (aka poop) of the obese mice to the waste of wild-type mice (and, yes, all of this was controlled for the amount of waste/poop). Lo and behold, the obese mice (the white bar) seemed to have gut bacteria which were significantly better at pulling calories out of the food, leaving less “leftover energy”.
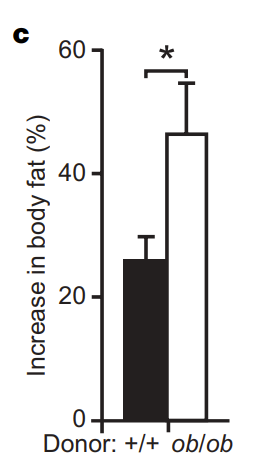
While an interesting result, especially when thinking about some of the causes and effects of obesity, a skeptic might look at that data and say that its inconclusive about the role of gut bacteria in obesity – after all, obese mice could have all sorts of other changes which make them more efficient at pulling energy out of food. To address that, the researchers did a very elegant experiment involving fecal transplant: that’s right, colonize one mouse with the bacteria from another mouse (by transferring poop). The figure to the right (figure 3c) shows the results of the experiment. After two weeks, despite starting out at about the same weight and eating similar amounts of the same food, wild type mice that received bacteria from other wild type mice showed an increase in body fat of about 27%, whereas the wild type mice that received bacteria from the obese mice showed an increase of about 47%! Clearly, gut bacteria in obese mice are playing a key role in calorie uptake!
In terms of areas of improvement, my main complaint about this study is just that it doesn’t go far enough. The paper never gets too deep on what exactly were the bacteria in each sample and we didn’t really get a sense of the real variation: how much do bacteria vary from mouse to mouse? Is it the completely different bacteria? Is it the same bacteria but different numbers? Is it the same bacteria but they’re each functioning differently? Do two obese mice have the same bacteria? What about a mouse that isn’t quite obese but not quite wild-type either? Furthermore, the paper doesn’t show us what happens if an obese mouse has its bacteria replaced with the bacteria from a wild-type mouse. These are all interesting questions that would really help researchers and doctors understand what is happening.
But, despite all of that, this was a very interesting finding and has major implications for doctors and researchers in thinking about how our complicated flora impact and are impacted by our health.
Paper: Turnbaugh et al., “An obesity-associated gut microbiome with increased capacity for energy harvest.” Nature (444). 21/28 Dec 2006. doi:10.1038/nature05414
“Omics” is the hot buzz-suffix in the life sciences for anything which uses the new sequencing/array technologies we now have available. You don’t study genes anymore, you study genomics. You don’t study proteins anymore – that’s so last century, you study proteomics now. And, who studies metabolism? Its all about metabolomics. There’s even a blog covering this with the semi-irreverent name “Omics! Omics!”.
This month’s paper from Science is from researchers at the NIH because it was the first time I ever encountered the term “antibodyome”. As some of you know, antibodies are the “smart missiles” of your immune system – they are built to recognize and attack only one specific target (i.e. a particular protein on a bacteria/virus). This ability is so remarkable that, rather than rely on human-generated constructs, researchers and biotech companies oftentimes choose to use antibodies to make research tools (i.e. using fluorescent antibodies to label specific things) and therapies (i.e. using antibodies to proteins associated with cancer as anti-cancer drugs).
How the immune system does this is a fascinating story in and of itself. In a process called V(D)J recombination – the basic idea is that your immune system’s B-cells mix, match, and scramble certain pieces of your genetic code to try to produce a wide range of antibodies to hit potentially every structure they could conceivably see. And, once they see something which “kind of sticks”, they undergo a process called affinity maturation to introduce all sorts of mutations in the hopes that you create an even better antibody.
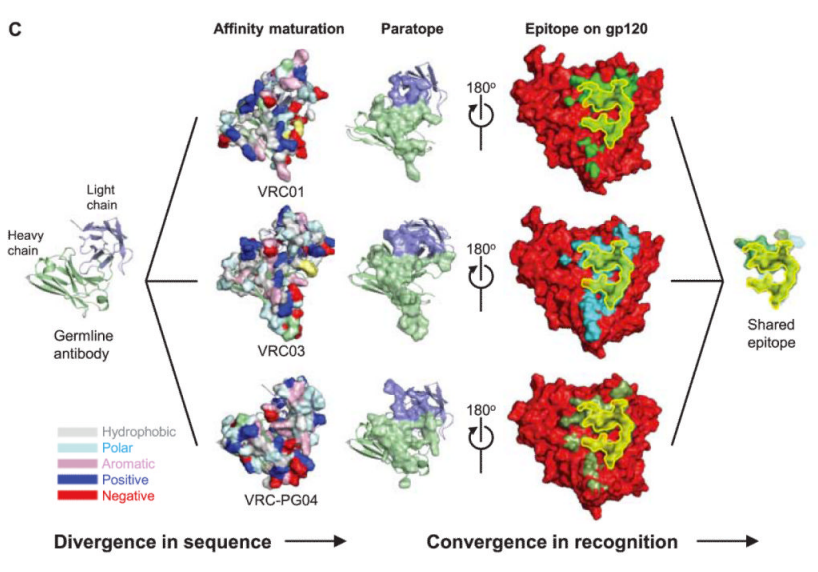
Which brings us to the paper I picked – the researchers analyzed a couple of particularly effective antibodies targeted at HIV, the virus which causes AIDS. What they found was that these antibodies all bound the same part of the HIV virus, but when they took a closer look at the 3D structures/the B-cell genetic code which made them, they found that the antibodies were quite different from one another (see Figure 3C below)
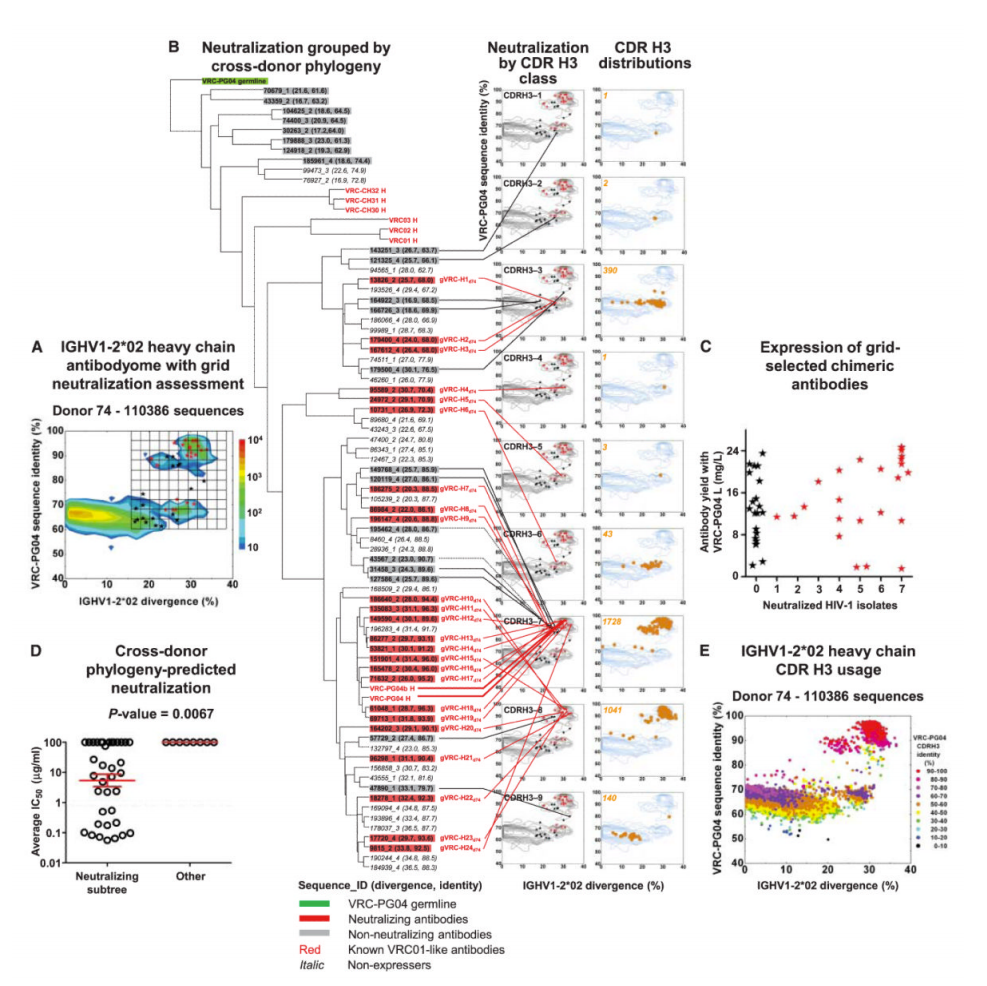
What’s more, not only were they fairly distinct from one another, they each showed *significant* affinity maturation – while a typical antibody has 5-15% of their underlying genetic code modified, these antibodies had 20-50%! To get to the bottom of this, the researchers looked at all the antibodies they could pull from the patient – their “antibodyome” (in the same way that a patient’s genome would be all of their genes) — and along with data from other patients, they were able to construct a genetic “family tree” for these antibodies (see Figure 6C below)
The analysis shows that many of the antibodies were derived from the same initial genetic VDJ “mix-and-match” but that afterwards, there were quite a number of changes made to that code to get the situation where a diverse set of structures/genetic codes could attack the same spot on the HIV virus.
While I wish the paper probed deeper into actual experimentation to take this analysis further (i.e. artificially using this method to create other antibodies with similar behavior), this paper goes a long way into establishing an early picture of what “antibodyomics” is. Rather than study the total impact of an immune response or just the immune capabilities of one particular B-cell/antibody, this sort of genetic approach lets researchers get a very detailed, albeit comprehensive look at where the body’s antibodies are coming from. Hopefully, longer term this also turns into a way for researchers to make better vaccines.
Paper: Wu et al., “Focused Evolution of HIV-1 Neutralizing Antibodies Revealed by Structures and Deep Sequencing.” Science (333). 16 Sep 2011. doi: 10.1126/science.1207532
The paper I will talk about this month is from April of this year and highlights the diversity of our “gut flora” (a pleasant way to describe the many bacteria which live in our digestive tract and help us digest the food we eat). Specifically, this paper highlights how a particular bacteria in the digestive tracts of some Japanese individuals has picked up a unique ability to digest certain certain sugars which are common in marine plants (e.g., Porphyra, the seaweed used to make sushi) but not in terrestrial plants.
Interestingly, the researchers weren’t originally focused on how gut flora function at all, but in understanding how marine bacteria digested marine plants. They started by studying a particular marine bacteria, Zobellia galactanivorans which was known for its ability to digest certain types of algae. Scanning the genome of Zobellia, the researchers were able to identify a few genes which were similar enough to known sugar-digesting enzymes but didn’t seem to have the ability to act on the “usual plant sugars”.
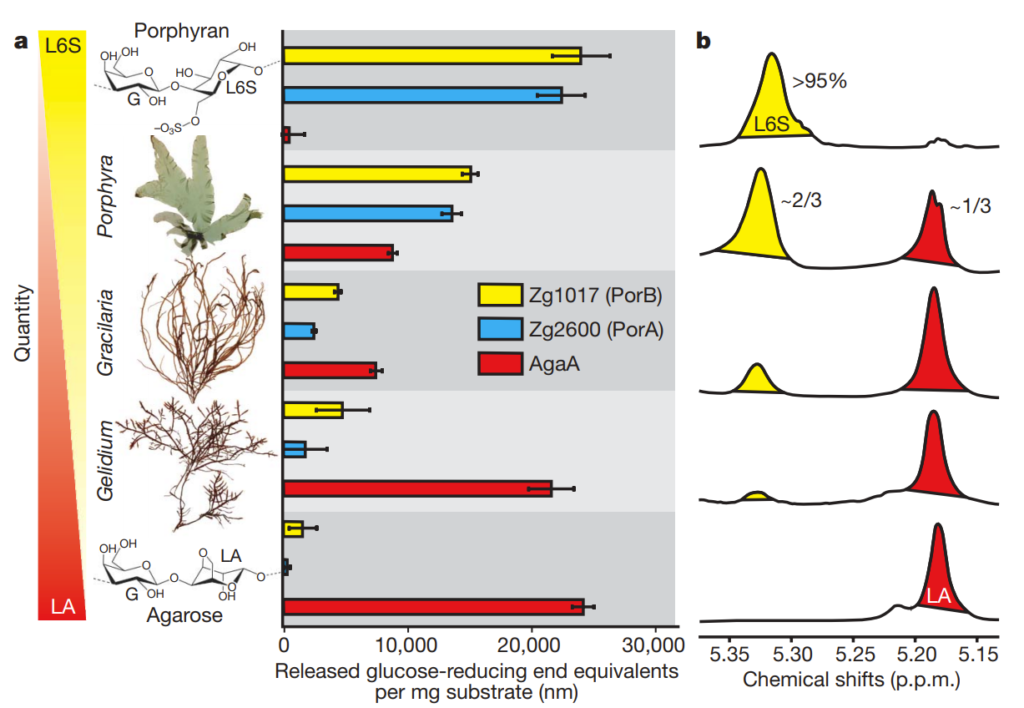
Two of the identified genes, which they called PorA and PorB, were found to be very selective in the type of plant sugar they digested. In the chart below (from Figure 1), 3 different plants are characterized along a spectrum showing if they have more LA (4-linked 3,6-anhydro-a-L-galactopyranose) chemical groups (red) or L6S (4-linked a-L-galactopyranose-6-sulphate) groups (yellow). Panel b on the right shows the H1-NMR spectrum associated with these different sugar mixes and is a chemical technique to verify what sort of sugar groups are present.
These mixes were subjected to PorA and PorB as well as AgaA (a sugar-digesting enzyme which works mainly on LA-type sugars like agarose). The bar charts in the middle show how active the respective enzymes were (as indicated by the amount of plant sugar digested).
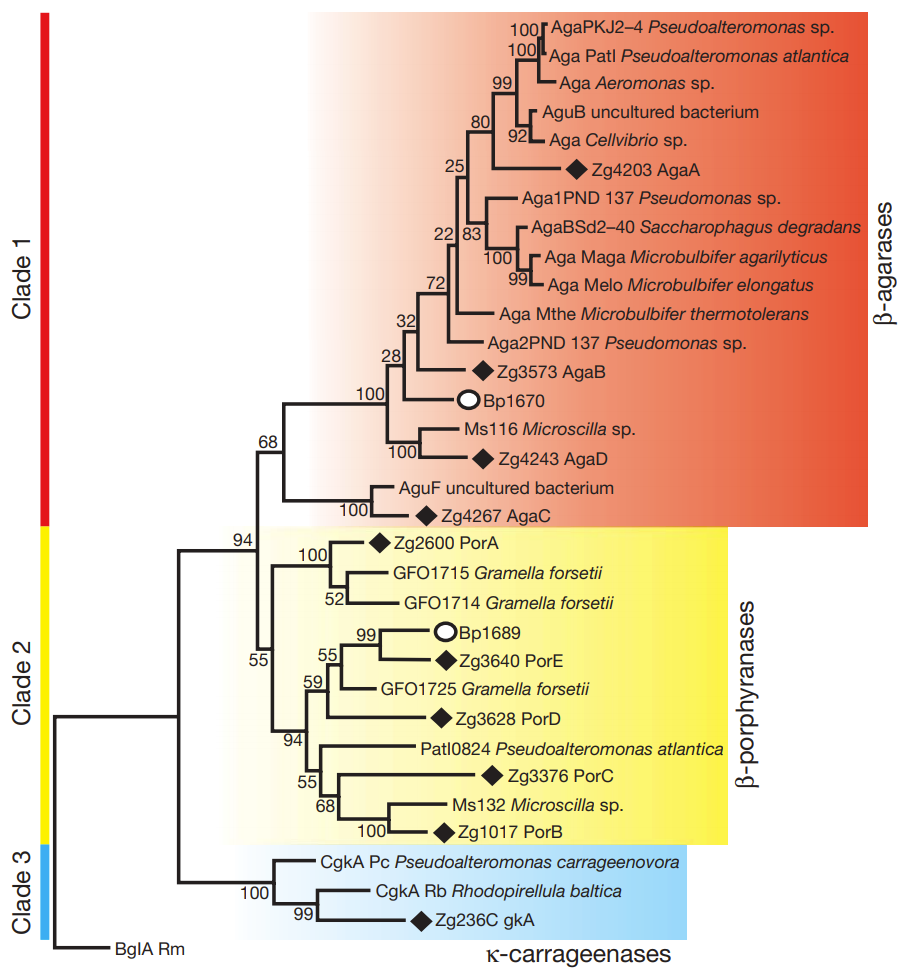
As you can see, PorA and PorB are only effective on L6S-type sugar groups, and not LA-type sugar groups. The researchers wondered if they had discovered the key class of enzyme responsible for allowing marine life to digest marine plant sugars and scanned other genomes for other enzymes similar to PorA and PorB. What they found was very interesting
What you see above is an evolutionary family tree for PorA/PorB-like genes. The red and blue boxes represent PorA/PorB-like genes which target “usual plant sugars”, but the yellow show the enzymes which specifically target the sugars found in nori (Porphyra, hence the enzymes are called porhyranases). All the enzymes marked with solid diamonds are actually found in Z. galactanivorans (and were henced dubbed PorC, PorD, and PorE – clearly not the most imaginative naming convention). The other identified genes, however, all belonged to marine bacteria… with the notable exception of Bateroides plebeius, marked with a open circle. And Bacteroides plebeius (at least to the knowledge of the researchers at the time of this publication) has only been found in the guts of certain Japanese people!
The researchers scanned the Bacteroides plebeius genome and found that the bacteria actually had a sizable chunk of genetic material which were a much better match for marine bacteria than other similar Bacteroides strains. The researchers concluded that the best explanation for this is that the Bacteroides plebeius picked up its unique ability to digest marine plants not on its own, but from marine bacteria (in a process called Horizontal Gene Transfer or HGT), most probably from bacteria that were present on dietary seaweed. Or, to put it more simply: your gut bacteria have the ability to “steal” genes/abilities from bacteria on the food we eat!
Cool! While this is a conclusion which we can probably never truly prove (it’s an informed hypothesis based on genetic evidence), this finding does make you wonder if a similar genetic screening process could identify if our gut flora have picked up any other genes from “dietary bacteria.”
Paper: Hehemann et al, “Transfer of carbohydrate-active enzymes from marine bacteria to Japanese gut microbiota.” Nature464: 908-912 (Apr 2010) – doi:10.1038/nature08937
The paper I read is something that is very near and dear to my heart. As is commonly known, individuals of Asian ancestry are more likely to experience dizziness and flushed skin after drinking alcohol. This is due to the prevalence of a genetic defect in the Asian population which affects an enzyme called Aldehyde Dehydrogenase 2 (ALDH2). ALDH2 processes one of the by-products of alcohol consumption (acetaldehyde).
In people with the genetic defect, ALDH2 works very poorly. So, people with the ALDH2 defect build up higher levels of acetaldehyde which leads them to get drunker (and thus hung-over/sick/etc) quicker. This is a problem for someone like me, who needs to drink a (comically) large amount of water to be able to properly process wine/beer/liquor. Interestingly, the anti-drinking drug Disulfiram (sold as “Antabuse” and “Antabus”) helps alcoholics keep off of alcohol by basically shutting down a person’s ALDH2, effectively giving them “Asian alcohol-induced flushing syndrome” and making them get drunk and sick very quickly.
So, what can you do? At this point, nothing really (except, either avoid alcohol or drink a ton of water when you do drink). But, I look forward to the day when there may actually be a solution. A group at Stanford recently identified a small molecule, Alda-1 (chemical structure above), which not only increases the effectiveness of normal ALDH2, but can help “rescue” defective ALDH2!
Have we found the molecule which I have been searching for ever since I started drinking? Jury’s still out, but the same group at Stanford partnered with structural biologists at Indiana University to conduct some experiments on Alda-1 to try to find out how it works.
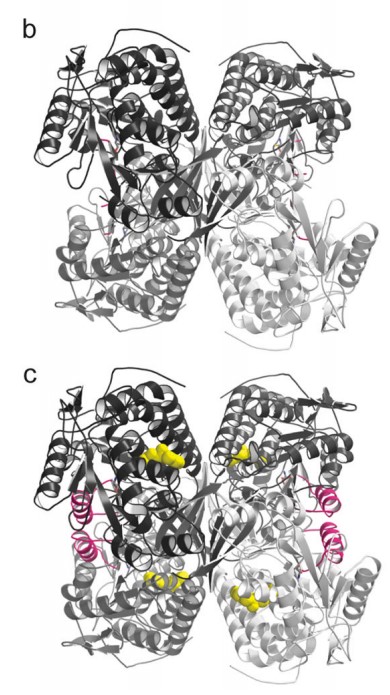
To do this, and why this paper was published in Nature Structural and Molecular Biology rather than another journal, they used a technique called X-ray Crystallography to “see” if (and how) Alda-1 interacts with ALDH2. Some of the results of these experiments are shown above. On the left, Panel B (on top) shows a 3D structure of the “defective’ version of ALDH2. If you’re new to structural biology papers, this will take some time getting used to it, but if you look carefully, you can see that ALDH2 is a tetramer: there are 4 identical pieces (in the top-left, top-right, bottom-left, bottom-right) which are attached together in the middle.
It’s not clear from this picture, but the defective version of the enzyme differs from the normal because it is unable to maintain the 3D structure needed to link up with a coenzyme (a chemical needed by enzymes which do this sort of chemical reaction to be able to work properly) called NAD+ or even carry out the reaction (the “active site”, or the part of the enzyme which actually carries out the reaction, is “disrupted” in the mutant).
So what does Alda-1 do, then? In the bottom (Panel C), you can see where the Alda-1 molecules (colored in yellow) are when they interact with ALDH2. While the yellow molecules have a number of impacts on ALHD2’s 3D structure, the most obvious changes are highlighted in pink (those have no clear counterpart in Panel B). This is the secret of Alda-1: it actually changes the shape of ALDH2, (partially) restoring the enzyme’s ability to bind with NAD+ and carry out the chemical reactions needed to process acetaldehyde, and all without actually directly touching the active site (this is something which you can’t see in the panel I shared above, but you can make out from other X-ray crystallography models in the paper).
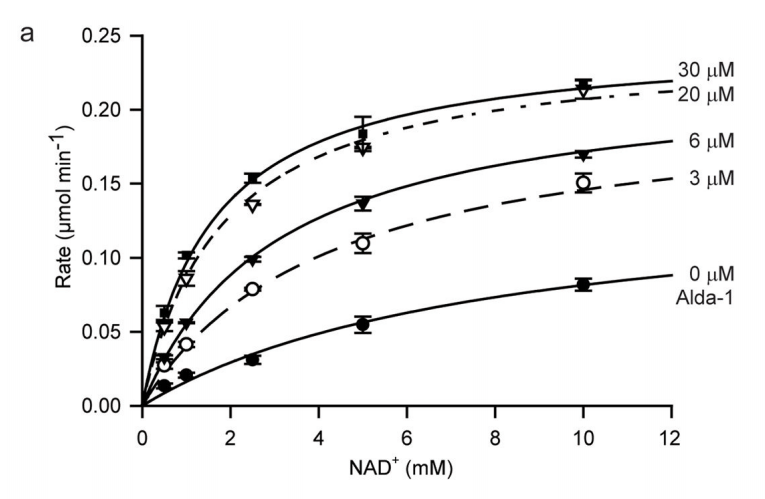
The result? If you look at the chart below (Panel A), you’ll see two relationships at play. First, the greater the amount of co-enzyme NAD+ (on the horizontal axis), the faster the reaction speed (on the vertical axis). But, if you increase the amount of Alda-1 from 0 uM (the bottom-most curve) to 30 uM (the highest-most curve), you see a dramatic increase in the enzyme’s reaction speed, for the same amount of NAD+. So, does Alda-1 activate ALDH2? Judging from this chart, it definitely does.
Alda-1 is particularly interesting because most of the chemicals/drugs which we are able to develop work by breaking, de-activating, or inhibiting something. Have a cold? Break the chemical pathways which lead to runny noses. Suffering from depression? De-activate the process which cleans up serotonin (“happiness” chemicals in the brain) quickly. After all, its much easier to break something than it is to fix/create something. But, instead, Alda-1 is actually an activator (rather than a de-activator), which the authors of the study leave as a tantalizing opportunity for medical science:
This work suggests that it may be possible to rationally design similar molecular chaperones for other mutant enzymes by exploiting the binding of compounds to sites adjacent to the structurally disrupted regions, thus avoiding the possibility of enzymatic inhibition entirely independent of the conditions in which the enzyme operates.
If only it were that easy (it’s not)…
Where should we go from here? Frankly, while the paper tackled a very interesting topic in a pretty rigorous fashion, I felt that a lot of the conclusions being drawn were not clear from the presented experimental results (which is why this post is a bit on the vague side on some of those details).
I certainly understand the difficulty when the study is on phenomena which is molecular in nature (does the enzyme work? are the amino acids in the right location?). But, I personally felt a significant part of the paper was more conjecture than evidence, and while I’m sure the folks making the hypotheses are very experienced, I would like to see more experimental data to back up their theories. A well-designed set of site-directed mutagenesis (mutating specific parts of ALDH2 in the lab to play around with they hypotheses that the group put out) and well-tailored experiments and rounds of X-ray crystallography could help shed a little more light on their fascinating idea.
Paper: Perez-Miller et al. “Alda-1 is an agonist and chemical chaperone for the common human aldehyde dehydrogenase 2 variant.” Nature Structural and Molecular Biology 17:2 (Feb 2010) –doi:10.1038/nsmb.1737
Unless you just discovered YouTube yesterday, you’ve probably seen countless videos of (and maybe even have tried?) the infamous Diet Coke + Mentos reaction… which brings us to the subject of this month’s paper.
An enterprising physics professor from Appalachian State University decided to have her sophomore physics class take a fairly rigorous look at what drives the Diet Coke + Mentos reaction and what factors might influence its strength and speed. They were not only able to publish their results in the American Journal of Physics, but the students were also given an opportunity to present their findings in a poster session (Professor Coffey reflected on the experience in a presentation she gave). In my humble opinion, this is science education at its finest: instead of having students re-hash boring experiments which they already know the results of, this allowed them to do fairly original research in a field which they probably had more interest in than in the typical science lab course.
So, what did they find?
The first thing they found is that it’s not an acid-base reaction. A lot of people, myself included, believe the diet coke + Mentos reaction is the same as the baking soda + vinegar “volcano” reactions that we all did as kids. Apparently, we were dead wrong, as the paper points out:
The pH of the diet Coke prior to the reaction was 3.0, and the pH of the diet Coke after the mint Mentos reaction was also 3.0. The lack of change in the pH supports the conclusion that the Mint Mentos–Diet Coke reaction is not an acid-base reaction. This conclusion is also supported by the ingredients in the Mentos, none of which are basic: sugar, glucose, syrup, hydrogenated coconut oil, gelatin, dextrin, natural flavor, corn starch, and gum arabic … An impressive acid-base reaction can be generated by adding baking soda to Diet Coke. The pH of the Diet Coke after the baking soda reaction was 6.1, indicating that much of the acid present in the Diet Coke was neutralized by the reaction.
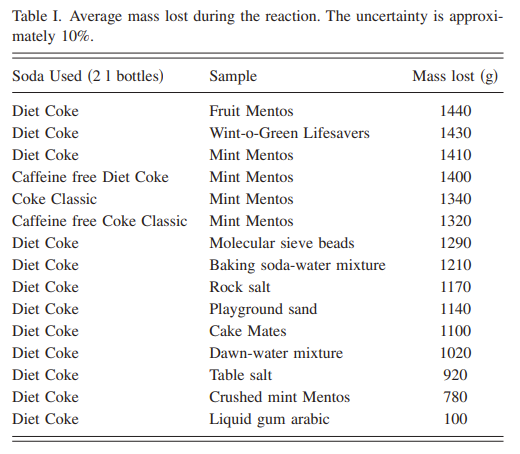
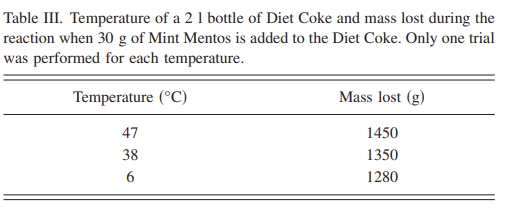
Secondly, the “reaction” is not chemical (no new compounds are created), but a physical response because the Mentos makes bubbles easier to form. The Mentos triggers bubble formation because the surface of the Mentos is itself extremely rough which allows bubbles to aggregate (like how adding string/popsicle stick to an oversaturated mixture of sugar and water is used to make rock candy). But that doesn’t explain why the Mentos + Diet Coke reaction works so well. The logic blew my mind but, in retrospect, is pretty simple. Certain liquids are more “bubbly” by nature – think soapy water vs. regular water. Why? Because the energy that’s needed to form a bubble is lower than the energy available from the environment (e.g., thermal energy). So, the question is, what makes a liquid more “bubbly”? One way is to heat the liquid (heating up Coke makes it more bubbly because heating the carbon dioxide inside the soda gives the gas more thermal energy to draw upon), which the students were able to confirm when they looked at how much mass was lost during a Mentos + Diet coke reaction under three different temperatures (Table 3 below):
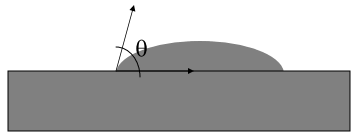
What else? It turns out that what other chemicals a liquid has dissolved is capable of changing the ease at which bubbles are made. Physicists/chemists will recognize this “ease” as surface tension (how tightly the surface of a liquid pulls on itself) which you can see visually as a change in the contact angle (the angle that the bubble forms against a flat surface, see below):
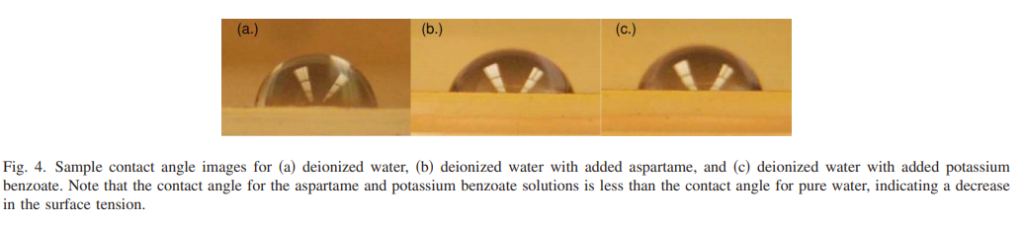
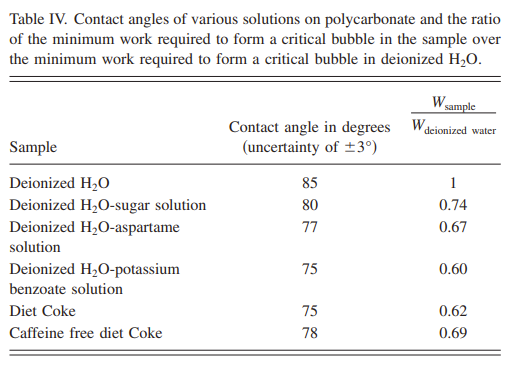
The larger the angle, the stronger the surface tension (the more tightly the liquid tries to pull in on itself to become a sphere). So, what happens when we add the artificial sweetener aspartame and potassium benzoate (both ingredients in Diet Coke) to water? As you can see in Figure 4 below, the contact angle in (b) [aspartame] and (c) [potassium benzoate] are smaller than (a) [pure water]. Translation: if you add aspartame and/or potassium benzoate to water, you reduce the amount of work that needs to be done by the solution to create a bubble. Table 4 below that shows the contact angles of a variety of solutions that the students tested as well as the amount of work needed to create a bubble relative to pure water:
This table also shows why you use Diet Coke rather than regular Coke (basically sugar-water) to do the Mentos thing – regular coke has a higher contact angle (and ~20% more energy needed to make a bubble).
Another factor which the paper considers is how long it takes the dropped Mentos to sink to the bottom. The faster a Mentos falls to the bottom, the longer the “average distance” that a bubble needs to travel to get to the surface. As bubbles themselves attract more bubbles, this means that the Mentos which fall to the bottom the fastest will have the strongest explosions. As the paper points out:
The speed with which the sample falls through the liquid is also a major factor. We used a video camera to measure the time it took for Mentos, rock salt, Wint-o-Green Lifesavers, and playground sand to fall through water from the top of the water line to the bottom of a clear 2 l bottle. The average times were 0.7 s for the Mentos, 1.0 s for the rock salt and the Lifesavers, and 1.5 s for the sand … If the growth of carbon dioxide bubbles on the sample takes place at the bottom of the bottle, then the bubbles formed will detach from the sample and rise up the bottle. The bubbles then act as growth sites, where the carbon dioxide still dissolved in the solution moves into the rising bubbles, causing even more liberation of carbon dioxide from the bottle. If the bubbles must travel farther through the liquid, the reaction will be more explosive.
So, in conclusion, what makes a Diet Coke + Mentos reaction stronger?
Temperature (hotter = stronger)
Adding substances which reduce the surface tension/contact angle
Increasing the speed at which the Mentos sink to the bottom (faster = stronger)
I wish I had done something like this when I was in college! The paper itself also goes into a lot of other things, like the use of an atomic force microscope and scanning electron microscopes to measure the “roughness” of the surface of the Mentos, so if you’re interested in additional things which can affect the strength of the reaction (or if you’re a science teacher interested in coming up with a cool project for your students), I’d strongly encourage taking a look at the paper!
Paper: Coffey, T. “Diet Coke and Mentos: What is really behind this physical reaction?”. American Journal of Physics76:6 (Jun 2008) – doi: 10.1119/1.2888546
Most people know that viruses are notoriously tricky disease-causing pathogens to tackle. Unlike bacteria which are completely separate organisms, viruses are parasites which use a host cell’s own DNA-and-RNA-and-protein producing mechanisms to reproduce. As a result, most viruses are extremely small, as they need to find a way into a cell to hijack the cell’s machinery, and, in fact, are oftentimes too small for light microscopes to see as beams of light have wavelengths that are too large to resolve them.
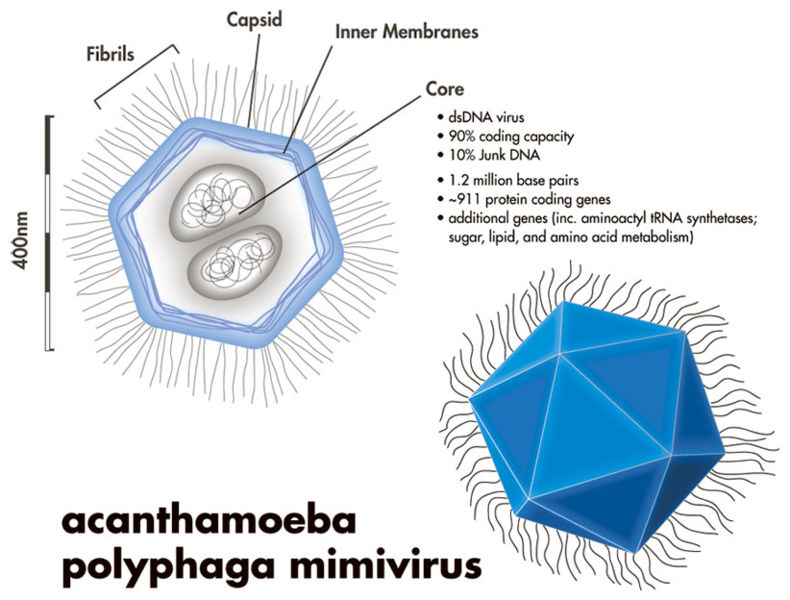
However, just because most viruses are small, doesn’t mean all viruses are. In fact, giant Mimiviruses, Mamaviruses, and Marseillesviruses have been found which are larger than many bacteria. The Mimivirus (pictured below), for instance, was so large it was actually identified incorrectly as a bacteria at first glance!
Little concrete detail is known about these giant viruses, and there has been some debate about whether or not these viruses constitute a new “kingdom” of life (the way that bacteria and archaebacteria are), but one thing these megaviruses have in common is that they are all found within amoeba!
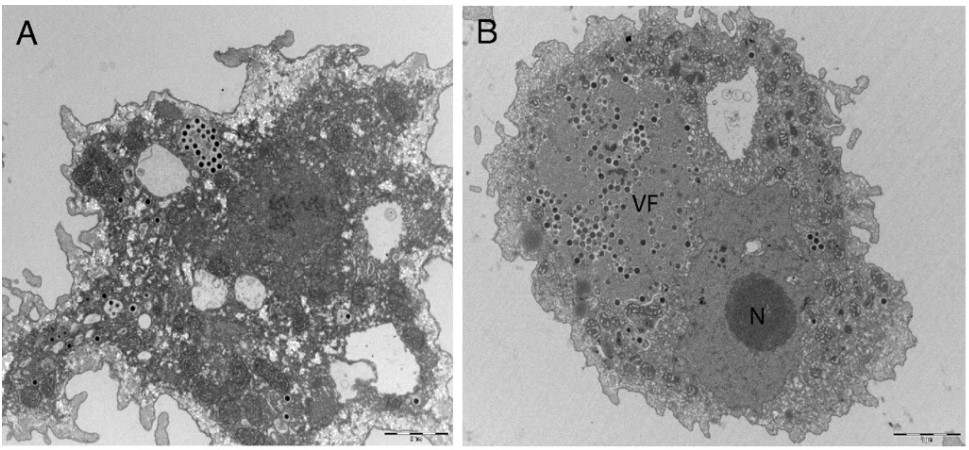
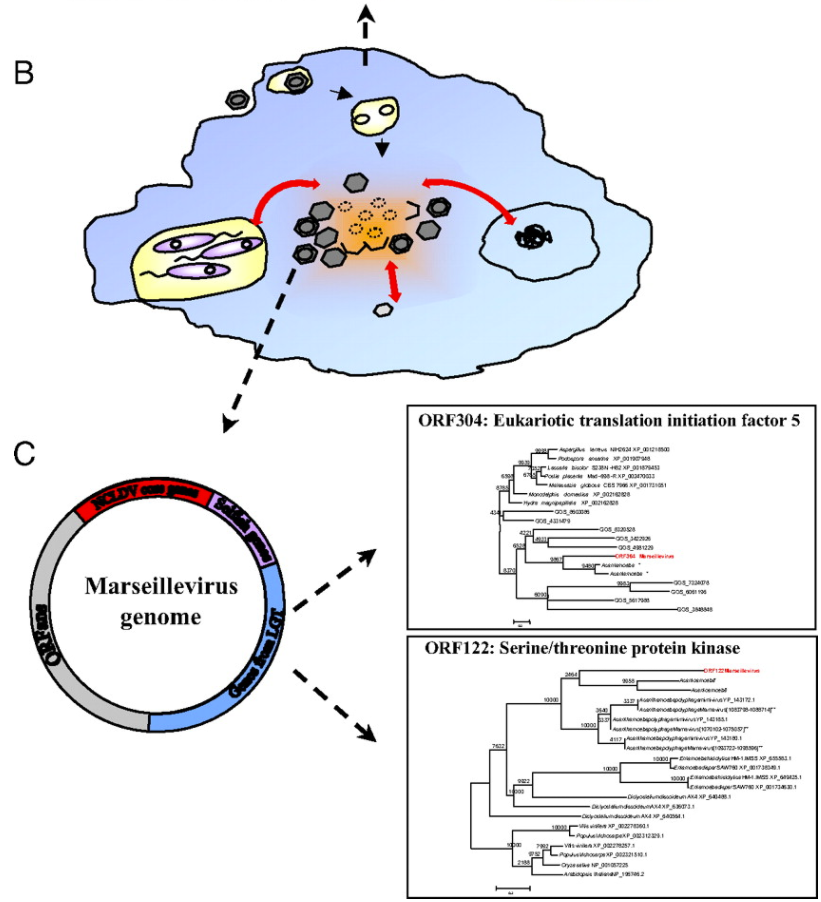
This month’s paper (HT: Anthony) looks into the genome of the Marseillesvirus to try to get a better understanding of the genetic origins of these giant viruses. The left-hand-side panel of picture below is an electron micrograph of an amoeba phagocytosing Marseillesvirus (amoeba, in the search for food, will engulf almost anything smaller than they are) and the right-hand-side panel shows the virus creating viral factories (“VF”, the very dark dots) within the amoeba’s cytoplasm. If you were to zoom in even further, you’d be able to see viral particles in different stages of viral assembly!
Ok, so we can see them. But just what makes them so big? What the heck is inside? Well, because you asked so nicely:
~368000-base pairs of DNA
This constitutes an estimated 457 genes
This is much larger than the ~5000 base pair genome of SV40, a popular lab virus, the ~10000 base pairs in HIV, the ~49000 in lambda phage (another scientifically famous lab virus), but is comparable to the genome sizes of some of the smaller bacterium
This is smaller than the ~1 million-base pair genome of the Mimivirus, the ~4.6 million of E. coli and the ~3.2 billion in humans
49 proteins were identified in the viral particles, including:
Protein kinases (primarily found in eukaryotic cells because they play a major role in cellular signaling networks)
Glutaredoxins and thioredoxins (usually only found in plant and bacterial cells to help fight off chemical stressors)
Ubiquitin system proteins (primarily in eukaryotic cells as they control which proteins are sent to a cell’s “garbage collector”)
Histone-like proteins (primarily in eukaryotic cells to pack a cell’s DNA into the nucelus)
As you can see, there are a whole lot of proteins which you would only expect to see in a “full-fledged” cell, not a virus. This begs the question, why do these giant viruses have so many extra genes and proteins that you wouldn’t have expected?
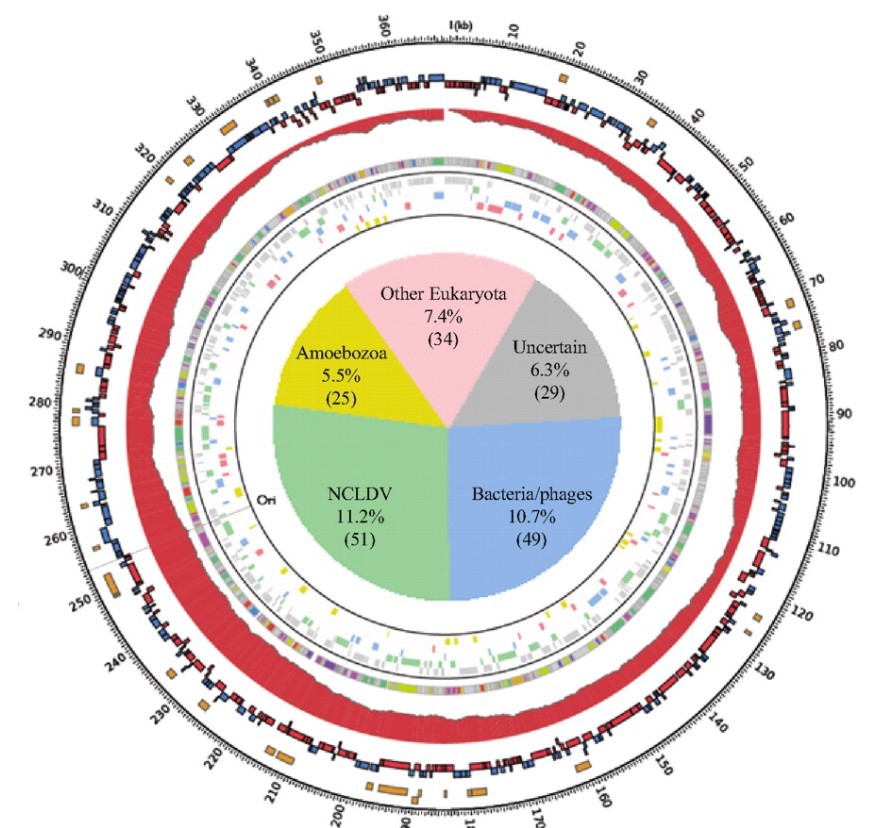
To answer this, the researchers ran a genetic analysis on the Marseillesvirus’s DNA, trying to identify not only which proteins were encoded in the DNA but also where those protein-encoding genes seem to come from (by identifying which species has the most similar gene structure). A high-level overview of the results of the analysis is shown in the circular map below:
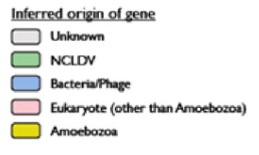
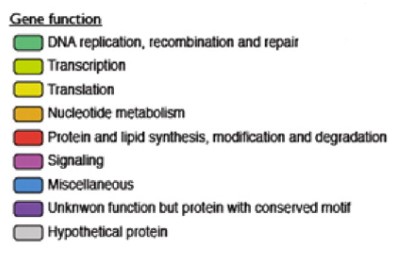
The outermost orange bands in the circle correspond to the proteins that were identified in the virus itself using mass spectrometry. The second row of red and blue bands represents protein-coding genes that are predicted to exist (but have yet to be detected in the virus; its possible they don’t make up the virus’s “body” and are only made while inside the amoeba, or even that they are not expressed at all). The gray ring with colored bands represents the researchers’ best guess as to what a predicted protein-coding gene codes for (based on seeing if the gene sequence is similar to other known proteins; the legend is below-right) whereas the colored bands just outside of the central pie chart represents a computer’s best determination of what species the gene seems to have come from (based on seeing if the gene sequence is similar to/the same as another species).
Of the 188 genes that a computational database identified as matching a previously characterized gene (~40% of all the predicted protein-coding genes), at least 108 come from sources outside of the giant viruses “evolutionary family”. The sources of these “misplaced” genes include bacteria, bacteria-infecting viruses called bacteriophages, amoeba, and even other eukaryotes! In other words, these giant viruses were genetic chimeras, mixed with DNA from all sorts of creatures in a way that you’d normally only expect in a genetically modified organism.
As many viruses are known to be able to “borrow” DNA from their hosts and from other viruses (a process called horizontal gene transfer), the researchers concluded that, like the immigrant’s conception of the United States of America, amoebas are giant genetic melting pots where genetic “immigrants” like bacteria and viruses comingle and share DNA (pictured below). In the case of the ancestors to the giant viruses, this resulted in viruses which kept gaining more and more genetic material from their amoeboid hosts and the abundance of bacterial and virus parasites living within.
his finding is very interesting, as it suggests that amoeba may have played a crucial role in the early evolution of life. In the same way that a cultural “melting pot” like the US allows the combination of ideas from different cultures and walks of life, early amoeba “melting pots” may have helped kickstart evolutionary jumps by letting eukaryotes, bacteria, and viruses to co-exist and share DNA far more rapidly than “regular” natural selection could allow.
Of course, the flip side of this is that amoeba could also very well be allowing super-viruses and super-bacteria to breed…
Paper: Boyer, Mickael et al. “Giant Marseillevirus highlights the role of amoebae as a melting pot in emergence of chimeric microorganisms.” PNAS 106, 21848-21853 (22 Dec 2009) – doi:10.1073/pnas.0911354106
This month, I read a paper (HT: my ex-college roommate Eric) by a group from Beth Israel about systemic inflammatory response syndrome (SIRS) following serious injury. SIRS, which is more commonly understood/found as sepsis, happens when the entire body is on high “immune alert.” In the case of sepsis, this is usually due to an infection of some sort. While an immune response may be needed to control an internal infection, SIRS is dangerous because the immune system can cause a great deal of collateral damage, resulting in potentially organ failure and death.
Whereas an infection has a clear link to sepsis, the logic for why injury would cause a similar immune response was less clear. In fact, for years, the best hypothesis from the medical community was that injury would somehow cause the bacteria which naturally live in your gut to appear where they’re not supposed to be. But this explanation was not especially convincing, especially in light of injuries like burns which could still lead to SIRS but which didn’t seem to directly affect gut bacteria.
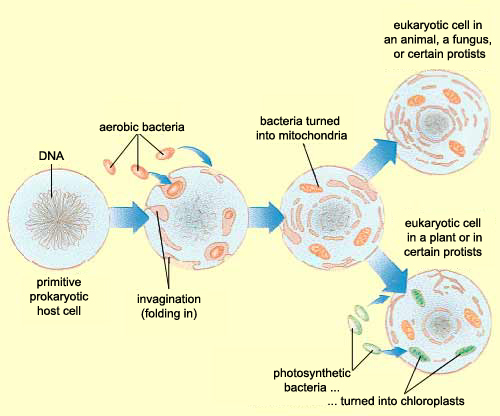
Zhang et al, instead of assuming that some type of endogenous bacteria was being released following injury, came up with an interesting hypothesis: it’s not bacteria which is triggering SIRS, but mitochondria. A first year cell biology student will be able to tell you that mitochondria are the parts of eukaryotic cells (sophisticated cells with nuclei) which are responsible for keeping the cell supplied with energy. A long-standing theory in the life science community (pictured above) is that mitochondria, billions of years ago, were originally bacteria which other, larger bacteria swallowed whole. Over countless rounds of evolution, these smaller bacteria became symbiotic with their “neighbor” and eventually adapted to servicing the larger cell’s energy needs. Despite this evolution, mitochondria have not lost all of their (theorized) bacterial ancestry, and in fact still retain bacteria-like DNA and structures. Zhang et al’s guess was that serious injuries could expose a mitochondria’s hidden bacterial nature to the immune system, and cause the body to trigger SIRS as a response.
Interesting idea, but how do you prove it? The researchers were able to show that 15 major trauma patients with no open wounds or injuries to the gut had thousands of times more mitochondrial DNA in their bloodstream than non-trauma victims. The researchers were then able to show that this mitochondrial DNA was capable of activating polymorphonuclear neutrophils, some of the body’s key “soldier” cells responsible for causing SIRS.
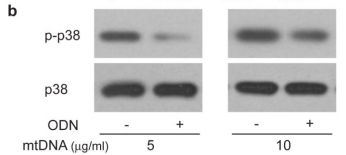
The figure above shows the result of an experiments illustrating this effect looking at the levels of a protein called p38 MAPK which gets chemically modified into “p-p38” when neutrophils are activated. As you can see in the p-p38 row, adding more mitochondrial DNA (mtDNA, “-” columns) to a sample of neutrophils increases levels of p-p38 (bigger, darker splotch), but adding special DNA which blocks the neutrophil’s mtDNA “detectors” (ODN, “+” columns) seems to lower it again. Comparing this with the control p38 row right underneath shows that the increase in p-p38 is likely due to neutrophil activation from the cells detecting mitochondrial DNA, and not just because the sample had more neutrophils/more p38 (as the splotches in the second row are all roughly the same).
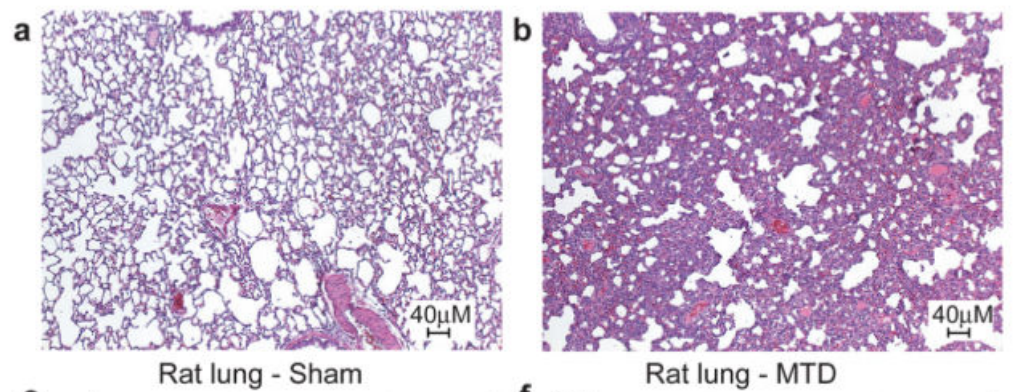
Cool, but does this mean that mitochondrial DNA actually causes a strong immune response outside of a test tube environment? To test this, the researchers injected mitochondrial DNA into rats and ran a full set of screens on them. While the paper showed numerous charts pointing out how the injected rats had strong immune response across multiple organs, the most striking are the pictures below which show a cross-section of a rat’s lungs comparing rats injected with a buffer solution (panel a, “Sham”) and rats injected with mitochondrial DNA (panel b, MTD). The cross-sections are stained with hematoxylin and eosin which highlight the presence of cells. The darker and “thicker” color on the right shows that there are many more cells in the lungs of rats injected with mitochondrial DNA – most likely from neutrophils and other “soldier cells” which have rushed in looking for bacteria to fight.
Amazing isn’t it? Not only did they provide part of the solution to the puzzle of injury-mediated SIRS (what they used to call “sterile SIRS”), but lent some support to the endosymbiont hypothesis!
Paper: Zhang, Qin et al. “Circulating Mitochondrial DAMPs Cause Inflammatory Responses to Injury.” Nature464, 104-108 (4 March 2010) – doi:10.1038/nature08780
The paper I read for this month brought up an interesting question I’ve always had but never really dug into: how do individual cells find things they can’t “see”? After all, there are lots of microbes out there who can’t always see where their next meal is coming from. How do they go about looking?
A group of scientists at Princeton University took a stab at the problem by studying the motion of individual slime mold amoeba (from the genus Dictyostelium) and published their findings in the (open access) journal PLoS ONE.
As one would imagine, if you have no idea where something is, your path to finding it will be somewhat random. What this paper sought to discover is what kind of random motion do amoeboid-like cells use? To those of you without the pleasure of training in biophysics or stochastic processes, that may sound like utter nonsense, but suffice to say physicists and mathematicians have created mathematically precise definitions for different kinds of “random motion”.
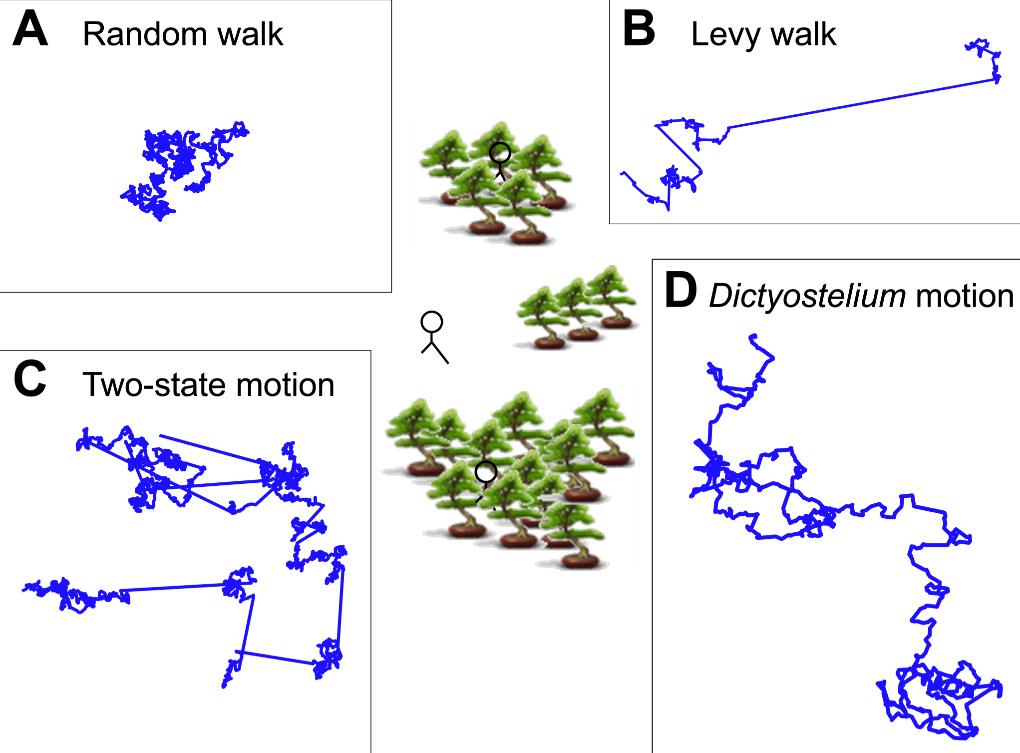
Now, if the idea of different kinds of randomness makes zero sense to you, then the following figure (from Figure 1 in the paper) might be able to help:
anel A describes a “traditional” random walk, where each “step” that a random walker takes is completely random (unpredictable and independent of the motion before it). As you can see, the path doesn’t really cover a lot of ground. After all, if you were randomly moving in different directions, you’re just as likely to move to the left as you are to move to the right. The result of this chaos is that you’re likely not to move very far at all (but likely to search a small area very thoroughly). As a result, this sort of randomness is probably not very useful for an amoeba hunting for food, unless for some reason it is counting on food to magically rain down on its lazy butt.
Panel B and C describe two other kinds of randomness which are better suited to covering more ground. Although the motion described in panel B (the “Levy walk”) looks very different from the “random walk” in Panel A, it is actually very similar on a mathematical/physical level. In fact, the only difference between the “Levy walk” and the “random walk” is that, in a “normal” random walk, the size of each step is constant, whereas the size of each “step” in a “Levy walk” can be different and, sometimes, extremely long. This lets the path taken cover a whole lot more ground.
A different way of using randomness to cover a lot of ground is shown in Panel C where, instead of taking big steps, the random path actually takes on two different types of motion. In one mode, the steps are exactly like the random walk in Panel A, where the path doesn’t go very far, but “searches” a local area very thoroughly. In another mode, the path bolts in a straight line for a significant distance before settling back into a random walk. This alternation between the different modes defines the “two-state motion” and is another way for randomness to cover more ground than a random walk.
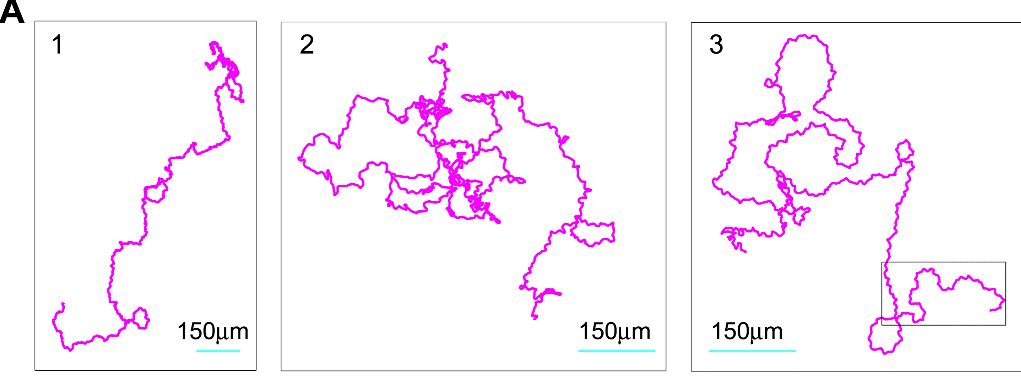
And what do amoeba use? Panel D gives a glimpse of it. Unlike the nice theoretical paths from Panels A-C rooted around random walks and different size steps or different modes of motion, the researchers found that slime mold amoeba like to zig-zag around a general direction which seems to change randomly over the course of ~10 min. Panel A of Figure 2 (shown below) gives a look at three such random paths taken over 10 hours.
The reason for this zig-zagging, or at least the best hypothesis at the time of publication, is that, unlike theoretical particles, amoeba can’t just move in completely random directions with random “step” sizes. They move by “oozing” out pseudopods (picture below), and this physical reality of amoeba motion basically makes the type of motion the researchers discussed more likely and efficient for a cell trying to make its way through uncharted territory.
The majority of the paper actually covers a lot of the mathematical detail involved in understanding the precise nature of the randomness of amoeboid motion, and is, frankly, an overly-intimidating way to explain what I just described above. In all fairness, that extra detail is more useful and precise in terms of understanding how amoeba move and give a better sense of the underlying biochemistry and biophysics of why they move that way. But what I found most impressive was that the paper took a very basic and straightforward experiment (tracking the motion of single cells) and applied a rigorous mathematical and physical analysis of what they saw to understand the underlying properties.
The paper was from May 2008 and, according to the PLoS One website, there have been five papers which have cited it (which I have yet to read). But, I’d like to think that the next steps for the researchers involved would be to:
See how much of this type of zig-zag motion applies to other cell types (i.e., white blood cells from our immune system), and why these differences might have emerged (different cell motion mechanisms? the need to have different types of random search strategies?)
Better understand what controls how quickly these cells change direction (and understand if there are drugs that can be used to modulate how our white blood cells find/identify pathogens or how pathogens find food)
Paper: Li, Liang et al. “Persistent Cell Motion in the Absence of External Signals: a Search Strategy for Eukaryotic Cells.” PLoS ONE3 (5): e2093 (May 2008) – doi:10.1371/journal.pone.0002093


