Turning 40 is a milestone that should come with a manual. It doesn’t, of course, but it does come with a decade’s worth of receipts for lessons learned the old fashioned way.
As I ponder the next decade ahead of me, I’ve been reflecting on the things I picked up in the last one that have shaped my understanding of people and the world around me. I share seven of these lessons in the hope they might be helpful to — or at least amusing to 😅 — the reader.
1. You Don’t Know Where You Rank in Someone’s Priorities Until You’ve Seen Them in a Crisis
It’s easy to be a good partner during the good times.
The real test of character comes during the bad times. It is only when the pressure is on and pleasantries feel like a wasteful luxury that people reveal their true priorities — and, especially, where you rank in those priorities. It’s in those moments of crisis that you can see who someone fundamentally is.
This advice applies to both love and business: if you can, don’t enter into a partnership — getting married, starting a company together, having a kid together — with someone until you understand how they handle crisis. How do they act when they’re scared, angry, or cornered? Do they collaborate with their partners, or do they retreat into self-preservation? Do they treat partners like equals or burdens? Sources of strength or resources to be exploited?
I’ve sadly learned several times in the past decade how people who are giving and collaborative when things are one way can quickly close off and prioritize themselves when things got tough.
To be clear, this isn’t to say people who react poorly under pressure are “bad” or deserve to be cut out of your life. Crises are difficult for even those with the strongest of moral character, and you can still have a friendly or productive working relationship with someone who doesn’t consider you one of their top priorities.
But understanding how someone acts in a crisis is a vital data point I would recommend thoroughly understanding before entering into any kind of serious partnership.
2. Profession can be an Oddly Good Read on a Person
I used to hate the question, “So, what do you do?”
It felt reductive, and almost insulting, especially when I was starting out in my career and my job was only a very small piece of what I felt I had to offer.
But I’ve come to appreciate that while a job is never the whole story about a person, it can be an incredibly revealing chapter. When you spend most of your waking hours on something that also shapes your finances, social status, and daily challenges, it inevitably molds you. Jobs define our incentives, hint at our training and skills, and frame our definitions of success and failure.
Knowing someone is a practicing doctor in the US, for example, gives you a hint about their:
age & education — given the amount of medical training necessary to practice medicine in the US
their income — likely relatively high, with more precision possible if you know their specialty
a sense of their views on the US healthcare system — I’ve never met a physician who likes the health insurance companies who impose rules and paperwork on them to get paid, their electronic medical record system, or medical malpractice lawsuits
their approach to risk — having being ingrained in the ethos of “first do no harm”
their views on credentials — given the amount of time (and money!) they spent on getting their Medical Degree as well as the additional licensing and certification necessary to practice
You won’t always get every detail right — and profession won’t give you a good indication on many aspects of their personality or personal lives that have little to do with their career — but it’s a more useful than not set of heuristics for understanding the people you meet.
This is why I’ve grown very wary of interfacing with politicians. To succeed there requires a level of self-obsession that’s hard to square with sincerity. Success is driven by saying what’s popular, not necessarily what’s true (or even what you believe). Politicians with any level of success are also surrounded by people paid to flatter them. It creates a backdrop where genuine connection is difficult, power dynamics are twisted, and relationships easily become transactional. Andrew Yang captured some of this in a piece he wrote for Politico Magazine in 2021 entitled “When I Ran for President, It Messed With My Head”.
Of course, there are exceptions. But in my experience, it is foolish to underestimate how influential the incentive structure of a career can be.
3. There’s Little Upside in Talking About Politics
To start with the obvious: policy matters. It shapes our lives, and in a democratic society, ignoring it is irresponsible.
That said, I suspect many of us engage with politics far too much for our own good. The problem is that modern political discussion and news isn’t about logic — it’s about evoking visceral, tribal outrage. This is bad for two reasons. First, it leads to bad policy — it makes us seek symbolic victories and “cultural” retribution rather than nuance and sustainable compromise. Secondly, it leads to bad behavior by training us to see the world in terms of “us” versus “them.”
In my 20s and early 30s, I loved a good political debate. I had a neat little box of “obvious things all reasonable people should believe.” That argumentativeness and certainty cost me. A long time friendship ended abruptly this past decade, likely over some position I took in one of those debates (it was never entirely clear to me). I also nearly became unfriendly with a former mentor over a political disagreement over that “neat little box of obviousness”.
As someone who values his relationships, these were not proud moments. And it led me to ask: what upside did I get from seeking these debates? A temporary satisfaction that “I am more righteous than the ‘other tribe’”? Scoring some kind of rhetorical point? Hardly seems worth it.
I now try to disengage from the daily outrage cycle of political news and who-said-what. After all, it rarely has real impact on policy, and the news cycle usually moves on after a few days. Instead, I try to focus on tracking substantive policy changes and analyses. It’s a lot more boring, but that’s a feature, not a bug.
I also am a bit embarrassed to admit but I now actively avoid discussing politics with people — both online and in real life. This isn’t to say that I don’t have my own opinions (and in moments of weakness, I’ll share some of them on social media), but in recognizing there’s little upside, I’ve come to realize nobody really cares what I think. They just want to know if they should get angry with me or at me, and I don’t see the point in playing that game any more.
4. Embrace the Unlikely
If my 30s taught me anything, it’s that the improbable is inevitable. In the last decade alone, I experienced things that I thought were highly unlikely to happen in my lifetime:
was fired
called as a witness in legal proceedings (twice!)
lived through a global pandemic
saw a vaccine developed in under a year
saw US inflation go above 9%
watched a massive political re-orientation on globalization in the West
Statistically speaking, over a long enough horizon, unlikely things will inevitably happen. But, beyond that, because unlikely things are highly correlated with one another, unlikely things will likely happen together. In my list above, for example, at least 3 of those things are directly related to COVID.
So, what do you do in a world where the improbable is not only inevitable but will likely co-occur?
First, prepare where you can. Get an estate plan, a rainy-day fund, a diversified portfolio, and make contingencies.
Second, and most importantly, try to embrace the unlikely. The chaos of 2020 was a period of great stress for me and my family. I remember wondering at points if this was the end of the global economy and of in-person interaction. These are especially unsettling thoughts when you have a toddler at home and weren’t sure when you would next see your aging parents.
Out of that tumultuous year came something positive that, I have to admit, would not have happened otherwise. So while 2020 was a terrible year in many fundamental ways, I’m grateful I was in a position to embrace it as an opportunity.
However, we live in an age of unhealthy hero worship powered by influencer marketing and interview podcasts. We assume that because someone is brilliant in one domain, they’re worth listening to in others.
But, in my experience, nothing could be further from the truth. What it takes to achieve genius-level mastery in one area often comes at the expense of others.
I’m always baffled when people ask Elon Musk for life advice or Warren Buffett for his opinion on anything besides investing. A quick read of their biographies shows that their personal lives are a mess. Their genius is highly specialized. Their situations are extreme. At best, you get a different perspective. More likely, you hear something that is likely completely irrelevant to you.
It’s worth remembering this the next time you hear a billionaire investor weigh in on sociology, a Nobel Laureate scientist weigh in on politics, or an author of fiction weigh in on technology. It’s far more fruitful to consult a few smart friends or read about actual expert opinion than to mind the opinion of a famous (and/or rich) person on a topic outside their expertise.
6. Good Taste is Overrated
In our careers, “good taste” is something worth cultivating and investing in. It signals judgment and makes you hard to replace, especially in this new world of AI.
But in life? I’ve come to a radically different conclusion: it’s much better to have low standards.
My inability to distinguish a $20 bottle of wine from a $200 one means I can get the same pleasure from wine as a world-class sommelier for a fraction of the cost.
My love for bad action movies and rewatching sitcoms means there’s always something to watch on an airplane.
My willingness to enjoy fast food means I can find a decent meal almost anywhere in America.
I used to be slightly ashamed of all of these things as evidence of my “uncultured palate”. Now, I see it as a gift. Being easy to please is a superpower for everyday contentment. And, it frees up time and mental energy to focus on what I can discern and care more about.
7. Play Stupid (Status) Games, Win Stupid Prizes
Many things we pursue in life aren’t for a tangible reward, but to signal something about ourselves to others and (sadly, often) to ourselves. These status games are everywhere, and the trap is that you can never win. There’s always a new car to buy, a more exclusive vacation to take, a new trend to follow. Marketers are masters at playing on this to keep us on the never-ending spending treadmill.
I felt this most acutely in the past decade with my kids. The entire “new parent industry” is a masterclass in exploiting a new parent’s desire to be a good parent. It’s engineered to make you feel guilty for all the things you aren’t doing (and all the products you aren’t buying) while feeling proud of the things that you are (and all the products you are buying). I remember the shame and anxiety when our eldest son didn’t seem to be hitting his speech milestones as quickly as the books suggested (or *gasp* as my friends’ kids were).
Thankfully, my level-headed wife and pragmatic pediatrician helped me see the bigger picture: our son was happy, healthy, and developing just fine on his own timeline. And sure enough, he started talking up a storm at two-and-a-half and was reading full books not long after.
This sort of un-grounded status seeking is everywhere: people staying in “prestigious sounding” jobs they hate, spending money to keep up with their friends’ Instagram lives, or chasing exotic investments just so they have a more exciting story to tell than “I just buy index funds.”
The lesson isn’t to drop out of all status games: that’s probably impossible. I will sheepishly admit I buy high-end gadgets not because I need them but to signal that I’m the type of person who buys high-end gadgets. I’ve also maintained a ridiculous 425-day+ Reddit streak for reasons I can’t particularly defend.
But, the lesson is to be deliberate. Recognize a status game for what it is, and then consciously decide if it’s one you actually want to play.
Seeing Past the Surface
Looking back, if there’s a single thread connecting these seven lessons, it’s about learning to see past the convenient surfaces. It’s about understanding the hidden incentives that drive people, the true priorities that emerge under pressure, and the surprising freedom that comes from ignoring the ones that don’t matter.
This process of looking deeper is never really finished. The biggest thing I’ve come to appreciate is that the learning never stops. I’m sure my 40s will dismantle some of the certainties I’ve built in my 30s, and I can’t wait to see which ones.
Nutrition is a field that is fraught with studies that are not powered or designed well enough to make strong conclusions about what types of diets are the “best”.
So it was interesting to see this article dig into the evidence over whether or not ultra-processed foods, a category that itself is a little hard to pin down — somehow we’re supposed to find it “natural” that burgers and cookies and breakfast cereals are in the same group — are “bad” for you and why.
The short answer is: yes they are bad, but it doesn’t seem to be exactly clear why. Potentially some combination of the foods being energy dense, quick-to-eat, and potentially impact our gut microbiome.
What was most impressive to me, however, were the number of randomized controlled trials that were attempted with confined study participants (the only way to know who’s eating what and how much) — those are hard to do (and consequently relatively small) but are probably the most convincing evidence.
Well worth a read if you’re even remotely interested in what the best science has to tell us about how and why processed foods impact our health.
The first RCT on UPFs [Ultra-Processed Foods] was carried out by a team led by integrative physiologist Kevin Hall, who until April was at the US National Institutes of Health (NIH), part of the HHS. For more than a decade, Hall has sought to overcome some of the limitations of nutrition research by confining study participants to a research hospital, so that their diets can be precisely recorded.
In 2015, he was approached by two Brazilian researchers at a meeting after he presented the results of one such study, comparing a low-carbohydrate, animal-product-based diet with a low-fat vegan diet. “They told me they had enjoyed my talk, but that my focus on nutrients was very twentieth century and that really, I should be thinking about the extent and purpose of processing food,” says Hall, who had not then heard of UPFs. He was sceptical but intrigued enough that he devised a trial in which 20 adults stayed at the NIH Clinical Center in Bethesda, Maryland, and consumed a diet high in either UPFs or unprocessed food for two weeks before swapping diets.
Like many other researchers, Hall defined UPFs using a system developed by Monteiro. Known as NOVA, it classifies food into four groups according to the extent, type and purpose of processing8. Unprocessed or minimally processed foods, such as vegetables and pasta, are at one end of the scale. At the other end are UPFs, which undergo multiple industrial processes and usually contain substances rarely used in home kitchens, such as high-fructose corn syrup, hydrogenated oils and additives, including colouring and emulsifiers.
Participants in Hall’s RCT could eat as much as they liked, but the food presented to them was matched for nutrient groups. To Hall’s surprise, the results, published in 2019, showed that participants consumed around 500 calories more per day on average while on the UPF diet — and gained an average of 0.9 kg over the two weeks9. They lost that same amount of weight while on the unprocessed diet.
Tech strategy is difficult AND fascinating because it’s unpredictable. In addition to worrying about the actions of direct competitors (i.e. Samsung vs Apple), companies need to also worry about the actions of ecosystem players (i.e. smartphones and AI vendors) who may make moves that were intended for something else but have far-reaching consequences.
However, because search is still a key source of traffic for most websites, this “default block” is almost certainly not turned on (at least by most website owners) for Google’s own scrapers, giving Google’s internal AI efforts a unique data advantage over it’s non-search-engine rivals.
Time will tell how the major AI vendors will adapt to this, but judging by the announcement this morning that Cloudflare is now actively flagging AI-powered search engine Perplexity as a bad agent, Cloudflare may have just given Google a powerful new weapon in it’s AI competition.
The Internet as we have known it for the past three decades is rapidly changing, but one thing remains constant: it is built on trust. There are clear preferences that crawlers should be transparent, serve a clear purpose, perform a specific activity, and, most importantly, follow website directives and preferences. Based on Perplexity’s observed behavior, which is incompatible with those preferences, we have de-listed them as a verified bot and added heuristics to our managed rules that block this stealth crawling.
If you’ve been following my selfhosting journey, you’ll know that I host some web applications — among them, network storage for my family, tools for working with PDFs, media streamers, a newsreader, etc. — from an inexpensive home server on my home network. It’s mostly a fun hobby but it’s helped teach me a great deal about web applications and Docker containers, and has helped me save some time and money by having applications I can control (and offer).
But one of the big questions facing every self-hoster is how to access these applications securely when I’m not at home? This is a conundrum as the two traditional options available have major tradeoffs
Opening up ports to the internet — One way to do this is to open up ports on your internet router and to forward traffic to those ports to your server. While this is the most direct solution to the problem of granting access to your hosted applications, this has several issues
First, some internet service providers and routers don’t actually let you do this!
Second, by opening up a port on your router, you’ll be opening up a door for everyone on the internet to access. This could expose your home network to malicious actors, and requires you to either accept the risk or set up additional security mechanisms to protect yourself.
Third, unless your internet service provider has granted you a static IP address (which is relatively rare for consumer internet plans), the IP address of your home will randomly change. Therefore in order to access your home server, you’ll need to setup a Dynamic DNS service which adds additional complexity to manage.
VPNs or VPN-like solutions (Twingate, Tailscale, etc) — The alternative to opening up a port is to leverage VPN and VPN-like technologies. This is much more secure (and, in fact, I use Twingate, a great VPN-like service, for this type of secure remote access). But, this has one major downside: it requires each device that wants to access your hosted applications to have a special client installed. This can be a hassle (especially if you want to grant access to someone less tech-savvy), and, in some cases, near impossible (if you’re dealing with devices like a connected TV or eReader or if the device is behind a firewall that doesn’t like VPNs).
I wanted a third option that:
would work nicely and securely with practically any internet-connected device
didn’t require client installation or configuration
didn’t require me to open up any new ports on my home router or expose a public IP address
could integrate authentication (as an extra layer of security)
That’s how I landed on Cloudflare tunnels!
Cloudflare Tunnels
Enter Cloudflare Tunnels, a product in the Cloudflare Zero Trust family of offerings. By running a small piece of software called cloudflared on your home network (i.e. as a Docker container on your home server), you can link:
the services/resources on your home network
domains hosted and secured by Cloudflare
third party authentication services (like Google login)
What that means is my local Stirling PDF tools (which live on my home server at the domain pdf.home) can now be reached by any internet-connected device at https://pdf.[mydomain.com] while locked behind a Google login which only allows users with specific email addresses through (i.e. my wife and myself)! All for free!
How to Setup
Transferring Your Domains
To get started, transfer your domains to Cloudflare. The specific instructions for this will vary by domain registrar (see some guidelines from Cloudflare). While you can technically just change the nameservers, I would highly recommend fully transferring your domains to Cloudflare for three reasons
Security: Cloudflare offers free and automatic HTTPS protection on all domains and basic DDOS protection as well
Extra Configurable Protection: I am not a cybersecurity expert but Cloudflare, even on their free tier, offer generous protection and domain features that you can further customize: bot protection, analytics, a sophisticated web application firewall, etc.
Creating the Tunnel
Once you have your domains transferred to Cloudflare, go into your Cloudflare dashboard and create your tunnel. Start by clicking on Zero Trust on the sidebar. Then go to Networks > Tunnels and click on Create Tunnel
Select the Cloudflared option
You will be asked to name your connector — pick any name that suits you, I went with OMV (since my homeserver is an OpenMediaVault server).
Then copy the installation command. Paste it somewhere and extract the really long token that starts with “ey…” as you’ll need it for the next step.
Setting up Cloudflared
Set up cloudflared. The following are instructions for OpenMediaVault. Depending on your home server setup, you may need to do different things to get a Docker container up and running using Docker compose but the Docker compose file and the general order of operations should match. Assuming you use OpenMediaVault…
If you haven’t already, make sure you have OMV Extras and Docker Compose installed (refer to the section Docker and OMV-Extras in my previous post, you’ll want to follow all 10 steps as I refer to different parts of the process throughout this post) and have a static local IP address assigned to your server.
Login to your OpenMediaVault web admin panel, and then go to [Services > Compose > Files] in the sidebar. Press the button in the main interface to add a new Docker compose file.
Under Name put down cloudflared and under File, adapt the following. Copy the token from the installation command
services:
cloudflared:
image: cloudflare/cloudflared
container_name: cloudflare-tunnel
restart: unless-stopped
command: tunnel run environment:
- TUNNEL_TOKEN={{the long token from before that starts with ey...}}
Code language:Dockerfile(dockerfile)
Once you’re done, hit Save and you should be returned to your list of Docker compose files. Notice that the new Cloudflared entry you created has a Down status, showing the container has yet to be initialized.
To start your Duplicati container, click on the new Cloudflared entry and press the (up) button. This will create the container, download any files needed, and run it.
Go back to your Cloudflare Zero Trust dashboard and click on Networks > Tunnels. If your Docker container worked, you should see a HEALTHY status showing that your Cloudflared container is up and running and connected to Cloudflare
Connecting your Services to the Tunnel
Click on your now active tunnel in the Cloudflare interface and click on Edit (or use the three-dot menu on the right hand side and select Configure) and then click on the Public Hostnames tab at the top. Press the Add a public hostname button.
For each service you want to make available, you will need to enter:
The Domain you wish to use (and have transferred to Cloudflare)
The Subdomain you want to map that service to — if the domain you wish to use is example.com, an example subdomain would be subdomain.example.com. If you leave this blank, it will map the “naked” domain (in this case example.com)
The Path you want to map the service to — if the domain and subdomain is subdomain.example.com and you add a path /path, then the service would be mapped to subdomain.example.com/path
The Type of service — Cloudflare will map many different types of resources, but chances are it’ll be HTTP.
The URL of the service relative to your network — this is the IP address (including port) that you use within your network. For example: 192.168.85.22:5678 (assuming your home server’s local IP is 192.168.85.22 and the port the service you want to link is set to 5678)
Press Save once you’re done and go ahead and test the subdomain/domain/path you just added (i.e. go to https://subdomain.example.com/path). It should take you straight to your application, except now it’s through a publicly accessible URL secured behind Cloudflare SSL!
Suggestions on Service Configuration
You need to repeat the above process for every selfthosted application that you want to make publicly available. Some suggestions based on what I did:
I made public every service I host with a few exceptions related to security, such as:
The OpenMediaVault console& WeTTY — Since this controls my entire home server setup (and grants access to all my network attached storage), it felt a little too important to make it easy to access (at least not without a VPN-like solution like the one I use, Twingate)
The PiHole administrative console — Similarly, because my PiHole is so vital to how the internet functions on my home network and regulates DNS in my home, it felt like locking this behind Twingate was reasonable
The NAS — As there are important and sensitive files on the OpenMediaVault file server, this was again one of the things where security trumped expediency.
Duplicati — I was less concerned about security here, but Duplicati is largely a “set it and forget it” type of backup tool, so it felt like there was little benefit to make this publicly available (and only potential risks)
The Ubooquity Admin interface — I’m again not super concerned about security here, but I have rarely needed to use it, so it didn’t make sense to add to my “surface area of attack” by exposing this as well
For a media server like Plex (or Jellyfin or Emby), you don’t have to, but I’d encourage you to connect two domains:
One that is easily memorable by you (i.e. plex.yourdomain.com) for you to access via browser over HTTPS and protected by authentication
and access control (see later in the post for how to configure)
One that has a long, hard-to-guess subdomain (i.e. hippo-oxygen-face.yourdomain.com) that will still be served over HTTPS but will not be protected by authentication. This will allow access to devices like smart TVs and the Plex clients which do not expect the servers to have additional authentication on top of them.
If you have Plex and you follow this second suggestion, you can further secure you server by going into your Plex configuration panel from a browser and pressing the wrench icon in the upper right (which takes you to settings)
Under your server settings (not Plex Web or your account settings which are above), go to Settings > Remote Access and press the Disable Remote Access button. This disables Plex’s built-in Relay feature which, while reasonably functional, is not under your control and limited in bandwidth / typically forces your server to transcode more than necessary To allow Plex apps (such as those on a TV or smartphone) to access your server, you’ll need to let Plex know what the right URL is. To do that go to Settings > Network and scroll down to Customer server access URLs. Here you’ll enter your hard-to-guess subdomain (i.e. https://hippo-oxygen-face.yourdomain.com) and press Save Changes. This informs Plex (and therefore all Plex clients) where to look for your media server
To confirm it all works, login to your Plex account at https://app.plex.tv/ and confirm that your server shows up (you may have to wait the first time you do this as Plex connects to your server).
Because this approach does NOT have extra access control and authentication, and because there are malicious actors who scan the internet for unguarded media server domains, it’s important that your subdomain here be long and hard-to-guess.
Authentication and Access Control
Because Cloudflare Tunnels are part of Cloudflare’s enterprise offering to help IT organizations make their applications secure & accessible, it comes with authentication support and access controls built-in for any application connected to your Cloudflare tunnel. This means you can easily protect your web applications against unwanted access.
To set this up, log back in to the Cloudflare dashboard, go to Zero Trust, and then go to Access > Policies in the sidebar and press the Add a policy button.
Enter a Policy name (pick something that describes how you’re restricting access, like “Jack and Jill only“).
You can then add the specific rules that govern the policy. Cloudflare supports a wide range of rules (including limiting based on IP address, country, etc), but assuming you just want to restrict access to specific individuals, I’d pick Emails under Selector and add the emails of the individual who are being granted access under Value. Once you’re set, press the Save button at the bottom!
Now you have a policy which can restrict a given application only to users with specific email addresses 🙌🏻.
Now, we just need to set up Cloudflare to apply that policy (and a specific login method) to the services in question. To do that, in the Cloudflare Zero Trust dashboard, go to Access > Applications in the sidebar and press the Add an application button in the screen that comes up.
Select the Self-hosted option. And then enter your Application name. Press the Add public hostname button and enter in the Subdomain, Domain, and Path for your previously-connected subdomain.
Scroll down to Access Policies and press the Select existing policies button and check the policy you just created and then hit the Confirm button. You should see something like the following
Finally you can configure which login methods you want to support. Out of the box, Cloudflare supports one-time PIN as a login method. Any user who lands on the domain in question the first time will be prompted to enter their email and, to verify the user is who they say they are, they’ll be sent a PIN number to that email address which they’ll then need to enter. This is straightforward, and if that’s all you want, accept the current default settings.
However, if, like me, you prefer to have your users login via a 3rd party authentication service (like Google or Facebook), then you have a little bit of extra work to do. Press the Manage login methods link where you’ll be taken to a screen in a new tab to configure your Authentication options. Where it says Login methods, press the Add new button.
You’ll be given the ability to add support for 3rd party logins through a number of identity providers (see below).
You can select any identity provider you wish — I went with Google — but whatever you select, Cloudflare will provide instructions for how to connect that provider to Cloudflare Zero Trust. These instructions can be quite complicated (see the Google instructions below) but if you follow Cloudflare’s instructions, you should be fine.
Once you’re done, press the Save button and return to the tab where you were configuring the application.
Under Login methods you should see that Cloudflare has checked the Accept all available identity providers toggle. You can keep that option, but as I configured only want my users to use Google, I unchecked that toggle and un-selected the One-time PIN option. I also checked the Instant Auth option (only available if there’s only one authentication method selected) which skips the authentication method selection step for your users. Then I pressed Next
The next two screens have additional optional configuration options which you can skip through by pressing Next and Save. Et voila! You have now configured an authentication and access control system on top of your now publicly accessible web service. Repeat this process for every service you want to put authentication & access control on and you’ll be set!
I have a few services I share access to with my wife and a few that are just for myself and so I’ve configured two access policies which I apply to my services differently. For services I intend to let anyone without access control reach (for example my Plex server for Plex apps), I simply don’t add them as an application in Cloudflare for access control (and just host them via subdomain).
I hope this is helpful for anyone who wants to make their selfhosted services accessible securely through the web. If you’re interested in how to setup a home server on OpenMediaVault or how to self-host different services, check out all my posts on the subject!
Inspired by some work from a group at Stanford on building a lab from AI agents, I’ve been experimenting with multi-agent AI conversations and workflows. But, because the space (at least to me) has seemed more focused on building more capable agents rather than coordinating and working with more agents, the existing tools and libraries have been difficult to carry out experiments.
To facilitate some of my own exploration work, I built what I’m calling a Multi-Agent ChatLab — a browser-based, completely portable setup to define multiple AI agents and facilitate conversations between them. This has made my experimentation work vastly simpler and I hope it can help someone else.
More about how to use this & the underlying design on this page.
And, to show off the tool, and for your amusement (and given my love of military history), here is a screengrab from the tool where I set up two AI Agents — one believing itself to be Napoleon Bonaparte and one believing itself to be the Duke of Wellington (the British commander who defeated Napoleon at Waterloo) — and had them describe (and compare!) the hallmarks of their military strategy.
Everywhere you look, the message seems clear: early detection (of cancer & disease) saves lives. Yet behind the headlines, companies developing these screening tools face a different reality. Many tests struggle to gain approval, adoption, or even financial viability. The problem isn’t that the science is bad — it’s that the math is brutal.
This piece unpacks the economic and clinical trade-offs at the heart of the early testing / disease screening business. Why do promising technologies struggle to meet cost-effectiveness thresholds, despite clear scientific advances? And what lessons can diagnostic innovators take from these challenges to improve their odds of success? By the end, you’ll have a clearer view of the challenges and opportunities in bringing new diagnostic tools to market—and why focusing on the right metrics can make all the difference.
Technologists often prioritize metrics like sensitivity (also called recall) — the ability of a diagnostic test to correctly identify individuals with a condition (i.e., if the sensitivity of a test is 90%, then 90% of patients with the disease will register as positives and the remaining 10% will be false negatives) — because it’s often the key scientific challenge and aligns nicely with the idea of getting more patients earlier treatment.
But when it comes to adoption and efficiency, specificity — the ability of a diagnostic test to correctly identify healthy individuals (i.e., if the specificity of a test is 90%, then 90% of healthy patients will register as negatives and the remaining 10% will be false positives) — is usually the more important and overlooked criteria.
The reason specificity is so important is that it can have a profound impact on a test’s Positive Predictive Value (PPV) — whether or not a positive test result means a patient actually has a disease (i.e., if the positive predictive value of a test is 90%, then a patient that registers as positive has a 90% chance of having the disease and 10% chance of actually being healthy — being a false positive).
What is counter-intuitive, even to many medical and scientific experts, is that because (by definition) most patients are healthy, many high accuracy tests have disappointingly low PPV as most positive results are actually false positives.
Let me present an example (see table below for summary of the math) that will hopefully explain:
Let’s say we have an HIV test with 99% sensitivity and 99% specificity — a 99% (very) accurate test!
If we tested 10,000 Americans at random, you would expect roughly 36 of them (0.36% x 10,000) to be HIV positive. That means, roughly 9,964 are HIV negative
99% sensitivity means 99% of the 36 HIV positive patients will test positive (99% x 36 = ~36)
99% specificity means 99% of the 9,964 HIV negative patients will test negative (99% x 9,964 = ~9,864) while 1% (1% x 9,964 = ~100) would be false positives
This means that even though the test is 99% accurate, it only has a positive predictive value of ~26% (36 true positives out of 136 total positive results)
Below (if you’re on a browser) is an embedded calculator which will run this math for any values of disease prevalence and sensitivity / specificity (and here is a link to a Google Sheet that will do the same), but you’ll generally find that low disease rates result in low positive predictive values for even very accurate diagnostics.
Typically, introducing a new diagnostic means balancing true positives against the burden of false positives. After all, for patients, false positives will result in anxiety, invasive tests, and, sometimes, unnecessary treatments. For healthcare systems, they can be a significant economic burden as the cost of follow-up testing and overtreatment add up, complicating their willingness to embrace new tests.
Below (if you’re on a browser) is an embedded calculator which will run the basic diagnostic economics math for different values of the cost of testing and follow-up testing to calculate the cost of testing and follow-up testing per patient helped (and here is a link to a Google Sheet that will do the same)
Finally, while diagnostics businesses face many of the same development hurdles as drug developers — the need to develop cutting-edge technology, to carry out large clinical studies to prove efficacy, and to manage a complex regulatory and reimbursement landscape — unlike drug developers, diagnostic businesses face significant pricing constraints. Successful treatments can command high prices for treating a disease. But successful diagnostic tests, no matter how sophisticated, cannot, because they ultimately don’t treat diseases, they merely identify them.
Case Study: Exact Sciences and Cologuard
Let’s take Cologuard (from Exact Sciences) as an example. Cologuard is a combination genomic and immunochemistry test for colon cancer carried out on patient stool samples. It’s two primary alternatives are:
a much less sensitive fecal immunochemistry test (FIT) — which uses antibodies to detect blood in the stool as a potential, imprecise sign of colon cancer
colonoscopies — a procedure where a skilled physician uses an endoscope to enter and look for signs of cancer in a patient’s colon. It’s considered the “gold standard” as it functions both as diagnostic and treatment (a physician can remove or biopsy any lesion or polyp they find). But, because it’s invasive and uncomfortable for the patient, this test is typically only done every 4-10 years
Cologuard is (as of this writing) Exact Science’s primary product line, responsible for a large portion of Exact Science’s $2.5 billion in 2023 revenue. It can detect earlier stage colon cancer as well as pre-cancerous growths that could lead to cancer. Impressively, Exact Sciences also commands a gross margin greater than 70%, a high margin achieved mainly by pharmaceutical and software companies that have low per-unit costs of production. This has resulted in Exact Sciences, as of this writing, having a market cap over $11 billion.
Yet for all its success, Exact Sciences is also a cautionary note, illustrating the difficulties of building a diagnostics company.
The company was founded in 1995, yet didn’t see meaningful revenue from selling diagnostics until 2014 (nearly 20 years later, after it received FDA approval for Cologuard)
The company has never had a profitable year (this includes the last 10 years it’s been in-market), losing over $200 million in 2023, and in the first three quarters of 2024, it has continued to be unprofitable.
Between 1997 (the first year we have good data from their SEC filings as summarized in this Google Sheet) and 2014 when it first achieved meaningful diagnostic revenue, Exact Sciences lost a cumulative $420 million, driven by $230 million in R&D spending, $88 million in Sales & Marketing spending, and $33 million in CAPEX. It funded those losses by issuing over $624 million in stock (diluting investors and employees)
From 2015-2023, it has needed to raise an additional $3.5 billion in stock and convertible debt (net of paybacks) to cover its continued losses (over $3 billion from 2015-2023)
Prior to 2014, Exact Sciences attempted to commercialize colon cancer screening technologies through partnerships with LabCorp (ColoSure and PreGenPlus). These were not very successful and led to concerns from the FDA and insurance companies. This forced Exact Sciences to invest heavily in clinical studies to win over the payers and the FDA, including a pivotal ~10,000 patient study to support Cologuard which recruited patients from over 90 sites and took over 1.5 years.
It took Exact Sciences 3 years after FDA approval of Cologuard for its annual diagnostic revenues to exceed what it spends on sales & marketing. It continues to spend aggressively there ($727M in 2023).
While it’s difficult to know precisely what the company’s management / investors would do differently if they could do it all over again, the brutal math of diagnostics certainly played a key role.
From a clinical perspective, Cologuard faces the same low positive predictive value problem all diagnostic screening tests face. From the data in their study on ~10,000 patients, it’s clear that, despite having a much higher sensitivity for cancer (92.3% vs 73.8%) and higher AUROC (94% vs 89%) than the existing FIT test, the PPV of Cologuard is only 3.7% (lower than the FIT test: 6.9%).
Even using a broader disease definition that includes the pre-cancerous advanced lesions Exact Sciences touted as a strength, the gap on PPV does not narrow (Cologuard: 23.6% vs FIT: 32.6%)
The economic comparison with a FIT test fares even worse due to the higher cost of Cologuard as well as the higher rate of false positives. Under the Center for Medicare & Medicaid Service’s 2024Q4 laboratory fee schedule, a FIT test costs $16 (CPT code: 82274), but Cologuard costs $509 (CPT code: 81528), over 30x higher! If each positive Cologuard and FIT test results in a follow-up colonoscopy (which has a cost of $800-1000 according to this 2015 analysis), the screening cost per cancer patient is 5.2-7.1x higher for Cologuard than for the FIT test.
This quick math has been confirmed in several studies.
A study by a group at the University Medical Center of Rotterdam concluded that “Compared to nearly all other CRC screening strategies reimbursed by CMS (Medicare), [Cologuard] is less effective and considerably more costly, making it an inefficient screening option” and would only be comparable at a much lower cost (~$6-18!)
While Medicare and the US Preventive Services Task Force concluded that the cost of Cologuard and the increase in false positives / colonoscopy complications was worth the improved early detection of colon cancer, it stayed largely silent on comparing cost-efficacy with the FIT test. It’s this unfavorable comparison that has probably required Exact Sciences to invest so heavily in sales and marketing to drive sales. That Cologuard has been so successful is a testament both to the value of being the only FDA-approved test on the market as well as Exact Science’s efforts in making Cologuard so well-known (how many other diagnostics do you know have an SNL skit dedicated to them?).
Not content to rest on the laurels of Cologuard, Exact Sciences recently published a ~20,000 patient study on their next generation colon cancer screening test: Cologuard Plus. While the study suggests Exact Sciences has improved the test across the board, the company’s marketing around Cologuard Plus having both >90% sensitivity and specificity is misleading, because the figures for sensitivity and specificity are for different conditions: sensitivity for colorectal cancer but specificity for colorectal cancer OR advanced precancerous lesion (see the table below).
Sensitivity and Specificity by Condition for Cologuard Plus Study (Google Sheet link)
Disentangling these numbers shows that while Cologuard Plus has narrowed its PPV disadvantage (now worse by 1% on colorectal cancer and even on cancer or lesion) and its cost-efficacy disadvantage (now “only” 4.4-5.8x more expensive) vs the FIT test (see tables below), it still hasn’t closed the gap.
Time will tell if this improved test performance translates to continued sales performance for Exact Sciences, but it is telling that despite the significant time and resources that went into developing Cologuard Plus, the data suggests it’s still likely more cost effective for health systems to adopt FIT over Cologuard Plus as a means of preventing advanced colon cancer.
Lessons for diagnostics companies
The underlying math of the diagnostics business and the lessons from Exact Sciences’ long path to dramatic sales has several key lessons for diagnostic entrepreneurs:
Focus on specificity — For diagnostic technologists, too little attention is paid to specificity while too much attention is paid on sensitivity. Positive predictive value and the cost-benefit for a health system are largely going to swing on specificity.
Aim for higher value tests — Because the development and required validation for a diagnostic can be as high as that of a drug or medical device, it is important to pursue opportunities where the diagnostic can command a high price. These are usually markets where the alternatives are very expensive because they require new technology (e.g. advanced genetic tests) or a great deal of specialized labor (e.g. colonoscopy) or where the diagnostic directly decides on a costly course of treatment (e.g. a companion diagnostic for an oncology drug).
Go after unmet needs — If a test is able to fill a mostly unmet need — for example, if the alternatives are extremely inaccurate or poorly adopted — then adoption will be determined by awareness (because there aren’t credible alternatives) and pricing will be determined by sensitivity (because this drives the delivery of better care). This also simplifies the sales process.
Win beyond the test — Because performance can only ever get to 100%, each incremental point on sensitivity and specificity is both exponentially harder to achieve but also delivers less medical or financial value. As a result, it can be advantageous to focus on factors beyond the test such as regulatory approval / guidelines adoption, patient convenience, time to result, and impact on follow-up tests and procedures. Cologuard gained a great deal from being “the first FDA-approved colon cancer screening test”. Non-invasive prenatal testing, despite low positive predictive values and limited disease coverage, gained adoption in part by helping to triage follow-up amniocentesis (a procedure which has a low but still frighteningly high rate of miscarriage ~0.5%). Rapid antigen tests for COVID have also similarly been adopted despite their lower sensitivity and specificity than PCR tests due to their speed, low cost, and ability to carry out at home.
Diagnostics developers must carefully navigate the intersection of scientific innovation and financial reality, while grappling with the fact that even the most impressive technology may be insufficient without taking into account clinical and economic factors to achieve market success.
Ultimately, the path forward for diagnostic innovators lies in prioritizing specificity, targeting high-value and unmet needs, and crafting solutions that deliver value beyond the test itself. While Exact Science’s journey underscores the difficulty of these challenges, it also illustrates that with persistence, thoughtful investment, and strategic differentiation, it is possible to carve out a meaningful and impactful space in the market.
Thankfully, Keras 3 lived up to it’s multi-backend promise and made switching to JAX remarkably easy. For my code, I simply had to make three sets of tweaks.
First, I had to change the definition of my container images. Instead of starting from Tensorflow’s official Docker images, I instead installed JAX and Keras on Modal’s default Debian image and set the appropriate environmental variables to configure Keras to use JAX as a backend:
jax_image = (
modal.Image.debian_slim(python_version='3.11')
.pip_install('jax[cuda12]==0.4.35', extra_options="-U")
.pip_install('keras==3.6')
.pip_install('keras-hub==0.17')
.env({"KERAS_BACKEND":"jax"}) # sets Keras backend to JAX .env({"XLA_PYTHON_CLIENT_MEM_FRACTION":"1.0"})
Code language:Python(python)
Second, because tf.data pipelines convert everything to Tensorflow tensors, I had to switch my preprocessing pipelines from using Keras’s ops library (which, because I was using JAX as a backend, expected JAX tensors) to Tensorflow native operations:
Lastly, I had a few lines of code which assumed Tensorflow tensors (where getting the underlying value required a .numpy() call). As I was now using JAX as a backend, I had to remove the .numpy() calls for the code to work.
Everything else — the rest of the tf.data preprocessing pipeline, the code to train the model, the code to serve it, the previously saved model weights and the code to save & load them — remained the same! Considering that the training time per epoch and the time the model took to evaluate (a measure of inference time) both seemed to improve by 20-40%, this simple switch to JAX seemed well worth it!
Model Architecture Improvements
There were two major improvements I made in the model architecture over the past few months.
First, having run my news reader for the better part of a year now, I now have accumulated enough data where my strategy to simultaneously train on two related tasks (predicting the human rating and predicting the length of an article) no longer required separate inputs. This reduced the memory requirement as well as simplified the data pipeline for training (see architecture diagram below)
Secondly, I was successfully able to train a version of my algorithm which can use dot products natively. This not only allowed me to remove several layers from my previous model architecture (see architecture diagram below), but because the Supabase postgres database I’m using supports pgvector, it means I can even compute ratings for articles through a SQL query:
UPDATE articleuser
SET ai_rating = 0.5 + 0.5 * (1 - (a.embedding <=> u.embedding)),
rating_timestamp = NOW(),
updated_at = NOW()
FROM articles a,
users u
WHERE articleuser.article_id = a.id
AND articleuser.user_id = u.id
AND articleuser.ai_rating ISNULL;
Code language:SQL (Structured Query Language)(sql)
The result is much greater simplicity in architecture as well as greater operational flexibility as I can now update ratings from the database directly as well as from serving a deep neural network from my serverless backend.
Model architecture (output from Keras plot_model function)
Making Sources a First-Class Citizen
As I used the news reader, I realized early on that the ability to just have sorted content from one source (i.e. a particular blog or news site) would be valuable to have. To add this, I created and populated a new sources table within the database to track these independently (see database design diagram below) which was linked to the articles table.
Newsreader database design diagram (produced by a Supabase tool)
I then modified my scrapers to insert the identifier for each source alongside each new article, as well as made sure my fetch calls all JOIN‘d and pulled the relevant source information.
With the data infrastructure in place, I added the ability to add a source parameter to the core fetch URLs to enable single (or multiple) source feeds. I then added a quick element at the top of the feed interface (see below) to let a user know when the feed they’re seeing is limited to a given source. I also made all the source links in the feed clickable so that they could take the user to the corresponding single source feed.
One recurring issue I noticed in my use of the news reader pertained to slow load times. While some of this can be attributed to the “cold start” issue that serverless applications face, much of this was due to how the news reader was fetching pertinent articles from the database. It was deciding at the moment of the fetch request what was most relevant to send over by calculating all the pertinent scores and rank ordering. As the article database got larger, this computation became more complicated.
To address this, I decided to move to a “pre-calculated” ranking system. That way, the system would know what to fetch in advance of a fetch request (and hence return much faster). Couple that with a database index (which effectively “pre-sorts” the results to make retrieval even faster), and I saw visually noticeable improvements in load times.
But with any pre-calculated score scheme, the most important question is how and when re-calculation should happen. Too often and too broadly and you incur unnecessary computing costs. Too infrequently and you risk the scores becoming stale.
The compromise I reached derived itself from the three ways articles are ranked in my system:
The AI’s rating of an article plays the most important role (60%)
How recently the article was published is tied with… (20%)
How similar an article is with the 10 articles a user most recently read (20%
These factors lent themselves to very different natural update cadences:
Newly scraped articles would have their AI ratings and calculated score computed at the time they enter the database
AI ratings for the most recent and the previously highest scoring articles would be re-computed after model training updates
On a daily basis, each article’s score was recomputed (focusing on the change in article recency)
The article similarity for unread articles is re-evaluated after a user reads 10 articles
This required modifying the reader’s existing scraper and post-training processes to update the appropriate scores after scraping runs and model updates. It also meant tracking article reads on the users table (and modifying the /read endpoint to update these scores at the right intervals). Finally, it also meant adding a recurring cleanUp function set to run every 24 hours to perform this update as well as others.
Next Steps
With some of these performance and architecture improvements in place, my priorities are now focused on finding ways to systematically improve the underlying algorithms as well as increase the platform’s usability as a true news tool. To that end some of the top priorities for next steps in my mind include:
Testing new backbone models — The core ranking algorithm relies on Roberta, a model released 5 years ago before large language models were common parlance. Keras Hub makes it incredibly easy to incorporate newer models like Meta’s Llama 2 & 3, OpenAI’s GPT2, Microsoft’s Phi-3, and Google’s Gemma and fine-tune them.
Solving the “all good articles” problem — Because the point of the news reader is to surface content it considers good, users will not readily see lower quality content, nor will they see content the algorithm struggles to rank (i.e. new content very different from what the user has seen before). This makes it difficult to get the full range of data needed to help preserve the algorithm’s usefulness.
Creating topic and author feeds — Given that many people think in terms of topics and authors of interest, expanding what I’ve already done with Sources but with topics and author feeds sounds like a high-value next step
I also endeavor to make more regular updates to the public Github repository (instead of aggregate many updates I had already made into two large ones). This will make the updates more manageable and hopefully help anyone out there who’s interested in building a similar product.
It is hard to find good analogies for running a startup that founders can learn from. Some of the typical comparisons — playing competitive sports & games, working on large projects, running large organizations — all fall short of capturing the feeling that the odds are stacked against you that founders have to grapple with.
But the annals of military history offer a surprisingly good analogy to the startup grind. Consider the campaigns of some of history’s greatest military leaders — like Alexander the Great and Julius Caesar — who successfully waged offensive campaigns against numerically superior opponents in hostile territory. These campaigns have many of the same hallmarks as startups:
Bad odds: Just as these commanders faced superior enemy forces in hostile territory, startups compete against incumbents with vastly more resources in markets that favor them.
Undefined rules: Unlike games with clear rules and a limited set of moves, military commanders and startup operators have broad flexibility of action and must be prepared for all types of competitive responses.
Great uncertainty: Not knowing how the enemy will act is very similar to not knowing how a market will respond to a new offering.
As a casual military history enthusiast and a startup operator & investor, I’ve found striking parallels in how history’s most successful commanders overcame seemingly insurmountable odds with how the best startup founders operate, and think that’s more than a simple coincidence.
In this post, I’ll explore the strategies and campaigns of 9 military commanders (see below) who won battle after battle against numerically superior opponents across a wide range of battlefields. By examining their approach to leadership and strategy, I found 5 valuable lessons that startup founders can hopefully apply to their own ventures.
Conquered the Persian Empire before the age of 32; spread Hellenistic culture across Eurasia and widely viewed in the West as antiquity’s greatest conqueror
Despite being a commoner, his victories led to the creation of the Han Dynasty (漢朝) and his being remembered as one of “the Three Heroes of the Han Dynasty” (漢初三傑)
Established Rome’s dominance in Gaul (France); became undisputed leader of Rome, effectively ending the Roman Republic, and his name has since become synonymous with “emperor” in the West
Despite being a commoner, became one of the most successful military commanders in the Mongol Empire. Successfully won battles in more theaters than any other commander (China, Central Asia, and Eastern Europe)
Created Central Asian empire with dominion over Turkey, Persia, Northern India, Eastern Europe, and Central Asia. His successors would eventually create the Mughal Empire in India which continued until the 1850s
Considered one of the greatest British commanders in history; Paved the way for Britain to overtake France as the pre-eminent military and economic power in Europe
Established Prussia as the pre-eminent Central European power after defeating nearly every major European power in battle; A cultural icon for the creation of Germany
Established a French empire with dominion over most of continental Europe; the Napoleonic code now serves as basis for legal systems around the world and the word Napoleon synonymous with military genius and ambition
Before I dive in, three important call-outs to remember:
Running a startup is not actually warfare — there are limitations to this analogy. Startups are not (and should not be) life-or-death. Startup employees are not bound by military discipline (or the threat of imprisonment if they are derelict). The concept of battlefield deception, which is at the heart of many of the tactics of the greatest commanders, also doesn’t translate well. Treating your employees / co-founders as one would a soldier or condoning violent and overly aggressive tactics would be both an ethical failure and a misread of this analogy.
Drawing lessons from these historical campaigns does not mean condoning the underlying sociopolitical causes of these conflicts, nor the terrible human and economic toll these battles led to. Frankly, many of these commanders were absolutist dictators with questionable motivations and sadistic streaks. This post’s focus is purely on getting applicable insights on strategy and leadership from leaders who were able to win despite difficult odds.
This is not intended to be an exhaustive list of every great military commander in history. Rather, it represents the intersection of offensive military prowess and my familiarity with the historical context. Just because I did not mention a particular commander has no bearing on their actual greatness.
With those in mind, let’s explore how the wisdom of historical military leaders can inform the modern startup journey. In the post, I’ll unpack five key principles (see below) drawn from the campaigns of history’s most successful military commanders, and show how they apply to the challenges ambitious founders face today.
1. Get in the trenches with your team
2. Achieve and maintain tactical superiority
3. Move fast and stay on offense
4. Unconventional teams win
5. Pick bold, decisive battles
Principle 1: Get in the trenches with your team
One common thread unites the greatest military commanders: their willingness to share in the hardships of their soldiers. This exercise of leadership by example, of getting “in the trenches” with one’s team, is as crucial in the startup world as it was on historical battlefields.
Every commander on our list was renowned for marching and fighting alongside their troops. This wasn’t mere pageantry; it was a fundamental aspect of their leadership style that yielded tangible benefits:
Inspiration: Seeing their leader work shoulder-to-shoulder with them motivated soldiers to push beyond their regular limits.
Trust: By sharing in their soldiers’ hardships, commanders demonstrated that they valued their troops and understood their needs.
Insight: Direct involvement gave leaders firsthand knowledge of conditions on the ground, informing better strategic decisions.
Perhaps no figure exemplified this better than Alexander the Great. Famous for being one of the first soldiers to jump into battle, Alexander was wounded seriously multiple times. This shared experience created a deep bond with his soldiers, culminating in his legendary speech at Opis where he was able to quell a mutiny of his soldiers, tired after years of campaigns, with a speech reminding them of their shared experiences:
Alexander the Great from Alexandria, Egypt (3rd Century BCE); Image Credit: Wikimedia
The wealth of the Lydians, the treasures of the Persians, and the riches of the Indians are yours; and so is the External Sea. You are viceroys, you are generals, you are captains. What then have I reserved to myself after all these labors, except this purple robe and this diadem? I have appropriated nothing myself, nor can any one point out my treasures, except these possessions of yours or the things which I am guarding on your behalf. Individually, however, I have no motive to guard them, since I feed on the same fare as you do, and I take only the same amount of sleep.
Nay, I do not think that my fare is as good as that of those among you who live luxuriously; and I know that I often sit up at night to watch for you, that you may be able to sleep.
But some one may say, that while you endured toil and fatigue, I have acquired these things as your leader without myself sharing the toil and fatigue. But who is there of you who knows that he has endured greater toil for me than I have for him? Come now, whoever of you has wounds, let him strip and show them, and I will show mine in turn; for there is no part of my body, in front at any rate, remaining free from wounds; nor is there any kind of weapon used either for close combat or for hurling at the enemy, the traces of which I do not bear on my person.
For I have been wounded with the sword in close fight, I have been shot with arrows, and I have been struck with missiles projected from engines of war; and though oftentimes I have been hit with stones and bolts of wood for the sake of your lives, your glory, and your wealth, I am still leading you as conquerors over all the land and sea, all rivers, mountains, and plains. I have celebrated your weddings with my own, and the children of many of you will be akin to my children.
Alexander the Great (as told by Arrian)
This was not unique to Alexander. Julius Caesar famously slept in chariots and marched alongside his soldiers. Napoleon was called “le petit caporal” by his troops after he was found sighting the artillery himself, a task that put him within range of enemy fire and was usually delegated to junior officers.
Frederick the Great also famously mingled with his soldiers while on tour, taking kindly to the nickname from his men, “Old Fritz”. Frederick understood the importance of this as he once wrote to his nephew:
“You cannot, under any pretext whatever, dispense with your presence at the head of your troops, because two thirds of your soldiers could not be inspired by any other influence except your presence.”
Frederick the Great
“Old Fritz” after the Battle of Hochkirch Image credit: WikiMedia Commons
For Startups
For founders, the lesson is clear: show up when & where your team is and roll up your sleeves so they can see you work beside them. It’s not just that startups tend to need “all hands on deck”, but being in the trenches also provides “on the ground” context that is valuable and help create the morale needed to succeed.
“I am personally on that line, in that machine, trying to solve problems personally where I can,” Musk said at the time. “We are working seven days a week to do it. And I have personally been here on zone 2 module line at 2:00 a.m. on a Sunday morning, helping diagnose robot calibration issues. So I’m doing everything I can.”
Principle 2: Achieve and maintain tactical superiority
To win battles against superior numbers requires a commander to have a strong tactical edge over their opponents. This can be in the form of a technological advantage (i.e. a weapons technology) or an organizational one (i.e. superior training or formations), but these successful commanders always made sure their soldiers could “punch above their weight”.
Alexander the Great, for example, leveraged the Macedonian Phalanx, a modification of the “classical Greek phalanx” used by the Greek city states of the era, that his father Philip II helped create.
The formation relied on “blocks” of heavy infantry equipped with six-meter (!!) long spears called sarissa which could rearrange themselves (to accommodate different formation widths and depths) and “pin” enemy formations down while the heavy cavalry would flank or exploit gaps in the enemy lines. This formation made Alexander’s army highly effective against every military force — Greeks, Persians, and Indians — it encountered.
A few centuries later, the brilliant Chinese commander Han Xin (韓信) leaned heavily on the value of military engineering. Han Xin (韓信)’s soldiers would rapidly repair & construct roads to facilitate his army’s movement or, at times, to deceive his enemies about which path he planned to take. His greatest military engineering accomplishment was at the Battle of Wei River (濰水) in 204 BCE. Han Xin (韓信) attacked the larger forces of the State of Qi (齊) and State of Chu (楚) and immediately retreated across the river, luring them to cross. What his rivals had not realized in their pursuit was that the water level of the Wei River was oddly low. Han Xin (韓信) had, prior to the attack, instructed his soldiers to construct a dam upstream to lower the water level. Once a sizable fraction of the enemy’s forces were mid-stream, Han Xin (韓信) ordered the dam released. The rush of water drowned a sizable portion of the enemy’s forces and divided the Chu (楚) / Qi (齊) forces letting Han Xin (韓信)’s smaller army defeat and scatter them.
A century and a half later, Roman statesman and military commander Gaius Julius Caesar also famously advocated military engineering capability in his wars with the Germanic tribes in Gaul. He became the first Roman commander to cross the Rhine (twice!) by building bridges to make the point to the Germanic tribes that he could invade them whenever he wanted. At the Battle of Alesia in 52 BCE, after trading battles with the skilled Gallic commander Vercingetorix who had united the tribes in opposition to Rome, Caesar besieged Vercingetorix’s fortified settlement of Alesia while simultaneously holding off Gallic reinforcements. Caesar did this by building 25 miles of fortifications surrounding Alesia in a month, all while outnumbered and under constant harassment from both sides by the Gallic forces! Caesar’s success forced Vercingetorix to surrender, bringing an end to organized resistance to Roman rule in Gaul for centuries.
Vercingetorix Throws Down his Arms at the Feet of Julius Caesar by Lionel Royer; Image Credit: Wikimedia
The Mongol commander Subutai similarly made great use of Mongol innovations to overcome defenders from across Eurasia. The lightweight Mongol composite bow gave Mongol horse archers a devastating combination of long range (supposedly 150-200 meters!) and speed (because they were light enough to be fired while on horseback). The Mongol horses themselves were another “biotechnological” advantage in that they required less water and food which let the Mongols wage longer campaigns without worrying about logistics.
In the 18th century, Frederick the Great transformed warfare on the European continent with a series of innovations. First, he drilled his soldiers stressing things like firing speed. It is said that lines of Prussian riflemen could fire over twice as fast as other European armies they faced, making them exceedingly lethal in combat.
Frederick’s Leibgarde Batallion in action; Image credit: Military Heritage
Frederick was also famous for a battle formation: the oblique order. Instead of attacking an opponent head on, the oblique order involves confronting the enemy line at an angle with soldiers massed towards one end of the formation. If one’s soldiers are well-trained and disciplined, then even with a smaller force in aggregate, the massed wing can overwhelm the opponent in one area and then flank or surround the rest. Frederick famously boasted that the oblique order could allow a skilled force to win over an opposing one three times its size.
Finally, Frederick is credited with popularizing horse artillery, the use of horse-drawn light artillery guns, in European warfare. With horse artillery units, Frederick was able to increase the adaptability of his forces and their ability to break through even numerically superior massed infantry by concentrating artillery fire where it was needed.
A few decades later, Napoleon Bonaparte became the undisputed master of much of continental Europe by mastering army-level logistics and organization. While a brilliant tactician and artillery commander, what set Napoleon’s military apart was its embrace of the “corps system”, which subdivided his forces into smaller, self-contained corps that were capable of independent operations. This allowed Napoleon the ability to pursue grander goals, knowing that he could focus his attention on the most important fronts of battle, while the other corps could independently pin an enemy down or pursue a different objective in parallel.
Napoleon triumphantly entering Berlin by Charles Meynier; Image Credit: Wikimedia Commons
Additionally, Napoleon invested heavily in overhauling military logistics, using a combination of forward supply depots and teaching his forces to forage for food and supplies in enemy territory (and, just as importantly, how to estimate what foraging can do to help determine the necessary supplies to take). This investment led to the invention of modern canning technology, first used to support the marches of the French Grande Armée. The result was Napoleon could field larger armies over longer campaigns all while keeping his soldiers relatively well-fed.
For Startups
Founders need to make sure they have a strong tactical advantage that fits their market(s). As evidenced above, it does not need to be something as grand as an unassailable advantage, but it needs to be a reliable winnerand something you continuously invest in if you plan on competing with well-resourced incumbents in challenging markets.
The successful payments company Stripe started out by making sure they would always win on developer ease of use, even going so far as to charge more than their competition during their Beta to make sure that their developer customers were valuing them for their ease of use. Stripe’s advantage here, and continuous investment in maintaining that advantage, ultimately let it win any customer that needed a developer payment integration, even against massive financial institutions. This advantage laid the groundwork for Stripe’s meteoric growth and expansion into adjacent categories from its humble beginnings.
Principle 3: Move fast and stay on offense
In both military campaigns and startups, speed and a focus on offense plays an outsized role in victory, because the ability to move quickly creates opportunities and increases resiliency to mistakes.
Few understood this principle as well as the Mongol commander Subutai who frequently took advantage of the greater speed and discipline of the Mongol cavalry to create opportunities to win.
In the Battle of the Kalka River (1223), Subutai took what initially appeared to be a Mongol defeat — when the Kievan Rus and their Cuman allies successfully entrapped the Mongol forces in the area — and turned it into a victory. The Mongols began a 9 day feigned retreat (many historians believe this was a real retreat that Subutai turned into a feigned one once he realized the situation), constantly tempting the enemy by staying just out of reach into overextending themselves in pursuit.
After 9 days, Subutai’s forces took advantage of their greater speed to lay a trap. Once the Mongols crossed the river they reformed their lines to lie in ambush. As soon as the Rus forces crossed the Kalka River, they found themselves surrounded and confronted with a cavalry charge they were completely unprepared for. After all, they had been pursuing what they thought was a fleeing enemy! Their backs against the river, the Rus forces (including several major princes) were annihilated.
Subutai took advantage of the Mongol speed advantage in a number of his campaigns, coordinating fast-moving Mongol divisions across multiple objectives. In its destruction of the Central Asian Khwarazmian empire, the Mongols, under the command of Subutai and Mongol ruler Genghis Khan, overwhelmed the defenders with coordinated maneuvers. While much of the Mongol forces attacked from the East, where the Khwarazmian forces massed, Subutai used the legendary Mongol speed to go around the Khwarazmian lines altogether, ending up at Bukhara, 100 miles to the West of the Khwarazmian defensive position! In a matter of months, the empire was destroyed and its rulers chased out, never to return.
A few hundred years later, the Englishman John Churchill, the Duke of Marlborough also proved the value of speed in 1704 when he boldly marched an army of 21,000 Dutch and English troops on a 250-mile march across Europe in just five weeks to place themselves between French and Bavarian forces and their target of Vienna. Had Vienna been attacked, it would have forced England’s ally the Holy Roman Empire out of the conflict, giving France the victory in the War of the Spanish Succession. This march was made all the more challenging as Marlborough had to find a way to feed and equip his army along this march without unnecessarily burdening the neutral and friendly territories they were marching through.
Marlborough’s “march to the Danube”; Image Credit: Rebel Redcoat
Marlborough’s maneuver threw the Bavarian and French forces off-balance. What originally was supposed to be an “easy” French victory culminated in a crushing defeat for the French at Blenheim which turned the momentum of the war. This victory solidified Marlborough’s reputation and even resulted in the British government agreeing to build a lavish palace (called Blenheim Palace in honor of the battle) as a reward to Marlborough.
Marlborough proved the importance of speed again at the Battle of Oudenarde. In 1708, French forces captured Ghent and Bruges (in modern day Belgium), threatening the alliance’s ability to maintain contact with Britain. Recognizing this, Marlborough force-marched his army to the city of Oudenarde, marching 30 miles in about as many hours. The French, confident from their recent victories and suffering from an internal leadership squabble, misjudged the situation, allowing Marlborough’s forces to build five pontoon bridges to move his 80,000 soldiers across the nearby river.
When the French commander received news that the allies were already at Oudenarde building bridges, he said, “If they are there, then the devil must have carried them. Such marching is impossible!“
Marlborough’s forces, not yet at full strength, engaged the French, buying sufficient time for his forces to cross and form up. Once in formation, they counterattacked and collapsed one wing of the French line, saving the Allied position in the Netherlands, and resulting in a bad defeat for French forces.
The Battle of Oudenarde, showing the position of the bridges the Allied forces needed to cross to get into position; Image Credit: WikiMedia Commons
For Startups
The pivotal role speed played in achieving victory for Subutai and the Duke of Marlborough apply in the startup domain as well. The ability to make fast decisions, to quickly shift focus to rapidly adapt to a new market context creates opportunities that slower moving incumbents (and military commanders!) cannot seize. Speed also gifts resiliency against mistakes and weak positions, in much the same way that speed let the Mongols and the Anglo-Prussian-Dutch alliance overcome their initial missteps at Kalka River and Oudenarde. Founders would be wise to remember to embrace speed of action in all they do.
Facebook and it’s (now in)famous “move fast, break things” motto is one classic example of how a company can internalize speed as a culture. It leveraged that to ship products and features which has kept it a leader in social and AI even in the face of constant competition and threats from well-funded companies like Google, Snapchat, and Bytedance.
Principle 4: Unconventional teams win
Another unifying hallmark of the great commanders is that they made unconventional choices with regards to their army composition. Relative to their peers, these commanders tended to build armies that were more diverse in class and nationality. While this required exceptional communication and inspiration skills, it gave the commanders significant advantages:
Ability to recruit in challenging conditions: For many of the commanders, the unconventional team structure was a necessity to build up the forces they needed given logistical / resource constraints while operating in enemy territory.
Operational flexibility from new tactics: Bringing on personnel from different backgrounds let commanders incorporate additional tactics and strategies, creating a more effective and flexible fighting force.
The Carthaginian general Hannibal Barca for example famously fielded a multi-nationality army consisting of Carthaginians, Libyans, Iberians, Numidians, Balearic soldiers, Gauls, and Italians. This allowed Hannibal to raise an army in hostile territory — after all, waging war in the heart of Italy against Rome made it difficult to get reinforcements from Carthage.
Illustration of troop types employed in the Second Punic War by Carthage/Hannibal Barca; Image Credit: Travis’s Ancient History
But, it also gave Hannibal’s army flexibility in tactics. Balearic slingers provided superior long range attack to the best Roman-used bows of the time. Numidian light cavalry provided Hannibal with fast reconnaissance and a quick way to flank and outmaneuver Roman forces. Gallic and Iberian soldiers provided shock infantry and cavalry. Each of these groups of soldiers added their own distinctive capabilities to Hannibal’s armies and great victories over Rome.
The Central Asian conqueror Timur similarly fielded a diverse army which included Mongols, Turks, Persians, Indians, Arabs, and others. This allowed Timur to field larger armies for his campaigns by recruiting from the countries he forced into submission. Like with Hannibal, it also gave Timur’s army access to a diverse set of tactics: war elephants (from India), infantry and siege technology from the Persians, gunpowder from the Ottomans, and more. This combination of operational flexibility and ability to field large armies let Timur build an empire which defeated every major power in Central Asia and the Middle East.
The Defeat by Timur of the Sultan of Dehli (from the Imperial Library of Emperor Akbar); Image credit: Wikimedia
It should not be a surprise that some of the great commanders were drawn towards assembling unconventional teams as several of them were ultimately “commoners”. Subutai (a son of a blacksmith who Genghis Khan took interest in), Timur (a common thief), and Han Xin (韓信, who famously had to beg for food in his childhood) all came from relatively humble origins. Napoleon, famous for declaring the military “la carrier est ouvérte aux talents” (“the career open to the talents”) and creating the first modern order of merit Légion d’honneur (open to all, regardless of social class), was similarly motivated by the difficulties he faced in securing promotion early in his career due to his not being from the French nobility.
But, by embracing more of a meritocracy, Napoleon was ultimately able to field some of the largest European armies in existence as he waged war successfully against every other major European power (at once).
First Légion d’Honneur Investiture by Jean-Baptiste Debret; Image Credit: Wikimedia
For Startups
Hiring is one of the key tasks for startup founders. While hiring the people that larger, better-resourced companies want to can be helpful for a startup, it’s important to always remember that transformative victories require unconventional approaches. Leaning on unconventional hires may help you get out of a salary bidding war with those deeper-pocketed competitors. Choosing unconventional hires may also add different skills and perspectives to the team.
In pursuing this strategy, it’s also vital to excel at communication & organization as well as fostering a shared sense of purpose. All teams require strong leadership to be effective but this is especially true with an unconventional team composition facing uphill odds.
The enterprise API company Zapier is one example of taking an unconventional approach to team construction by having been 100% remote from inception (pre-COVID even). This let the company assemble a team without being confined by location and eliminate the need to spend on unnecessary facilities. They’ve had to invest in norms around documentation and communication to make this work, and, while it’d be too far of a leap to argue all startups should go 100% remote, for Zapier’s market and team culture, it’s worked.
Principle 5: Pick bold, decisive battles
When in a challenging environment with limited resources, it’s important to prioritize decisive moves — actions which can result in a huge payoff — even if risky over safer, less impactful ones. This is as true for startups, which have limited runway and need to make a big splash in order to fundraise, as for military commanders who need more than just battlefield wins but strategic victories.
Few understood this as well as the Carthaginian general Hannibal Barca who, in waging the Second Punic War against Rome, crossed the Alps from Spain with his army in 218 BCE (at the age of 29!). Memorialized in many works of art (see below for one by Francisco Goya), this was a dangerous move (one that resulted in the loss of many men and almost his entire troop of war elephants) and was widely considered to be impossible.
The Victorious Hannibal Seeing Italy from the Alps for the First Time by Francisco Goya in Museo del Prado; Image Credit: Wikimedia
While history (rightly) remembers Hannibal’s boldness, it’s important to remember that Hannibal’s move was highly calculated. He realized that the Gauls in Northern Italy, who had recently been subjugated by the Romans, were likely to welcome a Roman rival. Through his spies, he also knew that Rome was planning an invasion of Carthage in North Africa. He knew he had little chance to bypass the Roman navy or Roman defensive placements if he invaded in another way.
And Hannibal’s bet paid off! Having caught the Romans entirely by surprise, they cancelled their planned invasion of Africa, and Hannibal lined up many Gallic allies to his cause. Within two years of his entry into Italy, Hannibal trounced the Roman armies sent to battle him at the River Ticinus, at the River Trebia, and at Lake Trasimene. Shocked by their losses, the Romans elected two consuls with the mandate to battle Hannibal and stop him once and for all.
Knowing this, Hannibal seized a supply depot at the town of Cannae, presenting a tempting target to the Roman consuls to prove themselves. They (foolishly) took the bait. Despite fielding over 80,000 soldiers against Hannibal’s 50,000, Hannibal successfully executed a legendary double-envelopment maneuver (see below) and slaughtered almost the entire Roman force that met him in battle.
Hannibal’s double envelopment of Roman forces at Cannae; Image Credit: Wikimedia
To put this into perspective, in the 2 years after Hannibal crossed the Alps, Hannibal’s army killed 20% of all male Romans over the age of 17 (including at least 80 Roman Senators and one previous consul). Cannae is today considered one of the greatest examples of military tactical brilliance, and, as historian Will Durant wrote, “a supreme example of generalship, never bettered in history”.
Cannae was a great example of Hannibal’s ability to pick a decisive battle with favorable odds. Hannibal knew that his only chance was to encourage the city-states of Italy to side with him. He knew the Romans had just elected consuls itching for a fight. He chose the field of battle by seizing a vital supply depot at Cannae. Considering the Carthaginians had started and pulled back from several skirmishes with the Romans in the days leading up to the battle, it’s clear Hannibal also chose when to fight, knowing full well the Romans outnumbered him. After Cannae, many Italian city-states and the kingdom of Macedon sided with Carthage. That Carthage ultimately lost the Second Punic War is a testament more to Rome’s indomitable spirit and the sheer odds Hannibal faced than any indication of Hannibal’s skills.
In the Far East, about a decade later, the brilliant Chinese military commander Han Xin (韓信) was laying the groundwork for the creation of the Han Dynasty (漢朝) in a China-wide civil war known as the the Chu-Han contention between the State of Chu (楚) and the State of Han (漢) led by Liu Bang (劉邦, who would become the founding emperor Gaozu 高祖 of the Han Dynasty 漢朝).
Under the leadership of Han Xin (韓信), the State of Han (漢) won many victories over their neighbors. Overconfident from those victories, his king Liu Bang (劉邦) led a Han (漢) coalition to a catastrophic defeat when he briefly captured but then lost the Chu (楚) capital of Pengcheng (彭城) in 205 BCE. Chu forces (楚) were even able to capture the king’s father and wife as hostages, and several Han (漢) coalition states switched their loyalty to the Chu (楚).
Map of the 18 states that existed at the start of the Chu-Han Contention, the two sides being the Han (in light purple on the Southwest) and the Chu (in green on the East); Image Credit: Wikimedia
To fix his king’s blunder, Han Xin (韓信) tasked the main Han (漢) army with setting up fortified positions in the Central Plain, drawing Chu (楚) forces there. Han Xin (韓信) would himself take a smaller force of less experienced soldiers to attack rival states in the North to rebuild the Han (漢) military position.
Sensing an opportunity to deal a decisive blow to the overconfident Zhao (趙), Han Xin (韓信) ordered a cavalry unit to sneak into the mountains behind the Zhao (趙) camp and to remain hidden until battle started. He then ordered half of his remaining army to position themselves in full view of the Zhao (趙) forces with their backs to the Tao River (洮水), something Sun Tzu’s Art of War (孫子兵法) explicitly advises against (due to the inability to retreat). This “error” likely reinforced the Zhao (趙) commander’s overconfidence, as he made no move to pre-emptively flank or deny the Han (漢) forces their encampment.
Han Xin (韓信) then deployed his full army which lured the Zhao (趙) forces out of their camp to counterattack. Because the Tao River (洮水) cut off all avenues of escape, the outnumbered Han (漢) forces had no choice but to dig in and fight for their lives, just barely holding the Zhao (趙) forces at bay. By luring the enemy out for what appeared to be “an easy victory”, Han Xin (韓信) created an opportunity for his hidden cavalry unit to capture the enemy Zhao (趙) camp, replacing their banners with those of the Han (漢). The Zhao (趙) army saw this when they regrouped, which resulted in widespread panic as the Zhao (趙) army concluded they must be surrounded by a superior force. The opposition’s morale in shambles, Han Xin (韓信) ordered a counter-attack and the Zhao (趙) army crumbled, resulting in the deaths of the Zhao (趙) commander and king!
Han Xin (韓信) bet his entire outnumbered command on a deception tactic based on little more than an understanding of his army’s and the enemy’s psychology. He won a decisive victory which helped reverse the tide of the war. The State of Zhao (趙) fell, and the State of Jiujiang (九江) and the State of Yan (燕) switched allegiances to the Han (漢). This battle even inspired a Chinese expression “fighting a battle with one’s back facing a river” (背水一戰) to describe fighting for survival in a “last stand”.
Caesar crosses the Rubicon by Bartolomeo Pinelli; Image Credit: Wikimedia
Roughly a century later, on the other side of the world, the Roman statesman and military commander Julius Caesar made a career of turning bold, decisive bets into personal glory. After Caesar conquered Gaul, Caesar’s political rivals led by Gnaeus Pompeius Magnus (Pompey the Great), a famed military commander, demanded Caesar return to Rome and give up his command. Caesar refused and crossed the Rubicon, a river marking the boundary of Italy, in January 49 BCE starting a Roman Civil War and coining at least two famous expressions (including alea iacta est – “the die is cast”) for “the point of no return”.
This bold move came as a complete shock to the Roman elite. Pompey and his supporters fled Rome. Taking advantage of this, Caesar captured Italy without much bloodshed. Caesar then pursued Pompey to Macedon, seeking a decisive land battle which Pompey, wisely, given his broad network of allies and command of the Roman navy, refused to give him. Instead, Caesar tried and failed to besiege Pompey at Dyrrhachium which forced him into retreat in Greece.
Pompey’s supporters, however, lacked Pompey’s patience (and judgement). Overconfident from their naval strength, numerical advantage, and Caesar’s failure at Dyrrhachium, they pressured Pompey into a battle with Caesar who was elated at the opportunity. In the summer of 48 BCE, the two sides met at the Battle of Pharsalus.
The initial battle formations at the Battle of Pharsalus; Image Credit: Wikimedia
Always cautious, Pompey took up a position on a mountain and oriented his forces such that his larger cavalry wing would have ability to overpower Caesar’s cavalry and then flank Caesar’s forces while his numerically superior infantry would be arranged deeper to smash through or at least hold back Caesar’s lines.
Caesar made a bold tactical choice when he saw Pompey’s formation. He thinned his (already outnumbered) lines to create a 4th reserve line of veterans which he positioned behind his cavalry at an angle (see battle formation above).
Caesar initiated the battle and attacked with two of his infantry lines. As Caesar expected, Pompey ordered a cavalry charge which soon forced back Caesar’s outnumbered cavalry. But Pompey’s cavalry then encountered Caesar’s 4th reserve line which had been instructed to use their javelins to stab at the faces of Pompey’s cavalry like bayonets. Pompey’s cavalry, while larger in size, was made up of relatively inexperienced soldiers and the shock of the attack caused them to panic. This let Caesar’s cavalry regroup and, with the 4th reserve line, swung around Pompey’s army completing an expert flanking maneuver. Pompey’s army, now surrounded, collapsed once Caesar sent his final reserve line into battle.
Caesar’s boldness and speed of action let him take advantage of a lapse in Pompey’s judgement. Seeing a rare opportunity to win a decisive battle, Caesar was even willing to risk a disadvantage in infantry, cavalry, and position (Pompey’s army had the high ground and had forced Caesar to march to him). But this strategic and tactical gamble (thinning his lines to counter Pompey’s cavalry charge) paid off as Pharsalus shattered the myth of Pompey’s inevitability. Afterwards, Pompey’s remaining allies fled or defected to Caesar, and Pompey himself fled to Egypt where he was assassinated (by a government wishing to win favor with Caesar). And, all of this — from Gaul to crossing the Rubicon to the Civil War — paved the way for Caesar to become the undisputed master of Rome.
For Startups
Founders need to take bold, oftentimes uncomfortable bets that have large payoffs. While a large company can take its time winning a war of attrition, startups need to score decisive wins quickly in order to attract talent, win deals, and shift markets towards them. Only taking the “safe and rational” path is a failure to recognize the opportunity cost when operating with limited resources.
In other words, founders need to find their own Alps / Rubicons to cross.
In the startup world, few moves are as bold (while also uncomfortable and risky) as big pivots. But, there are examples of incredible successes like Slack that were able to make this work. In Slack’s case, the game they originally developed ended up a flop, but CEO & founder Stewart Butterfield felt the messaging product they had built to support the game development had potential. Leaning on that insight, over the skepticism of much of his team and some high profile investors, Butterfield made a bet-the-company move similar to Han Xin (韓信) digging in with no retreat which created a seminal product in the enterprise software space.
Summary
I hope I’ve been able to show that history’s greatest military commanders can offer valuable lessons on leadership and strategy for startup founders.
The five principles derived from studying some of the commanders’ campaigns – the importance of getting in the trenches, achieving tactical superiority, moving fast, building unconventional teams, and picking bold, decisive battles – played a key role in the commanders’ success and generalize well to startup execution.
After all, what is a more successful founder than one who can recruit teams despite resource constraints (unconventional teams), inspire them (by getting in the trenches alongside them), and move with speed & urgency (move fast) to take a competitive edge (achieve tactical superiority) and apply it where there is the greatest chance of a huge impact on the market (pick bold, decisive battles).
Electrifying our (Bay Area) home was a complex and drawn-out process, taking almost two years.
Installing solar panels and storage was particularly challenging, involving numerous hurdles and unexpected setbacks.
We worked with a large solar installer (Sunrun) and, while the individuals we worked with were highly competent, handoffs within Sunrun and with other entities (like local utility PG&E and the local municipality) caused significant delays.
While installing the heat pumps, smart electric panel, and EV charger was more straightforward, these projects also featured greater complexity than we expected.
The project resulted in significant quality of improvements around home automation and comfort. However, bad pricing dynamics between electricity and natural gas meant direct cost savings from electrifying gas loads are, at best, small. While solar is an economic slam-dunk (especially given the rising PG&E rates our home sees), the batteries, in the absence of having backup, have less obvious economic value.
Our experience underscored the need for the industry to adopt a more holistic approach to electrification and for policymakers to make the process more accessible for all homeowners to achieve the state’s ambitious goals.
Why
The decision to electrify our home was an easy one. From my years of investing in & following climate technologies, I knew that the core technologies were reliable and relatively inexpensive. As parents of young children, my wife and I were also determined to contribute positively to the environment. We also knew there were abundant financial supports from local governments and utilities to help make this all work.
Yet, as we soon discovered, what we expected to be a straightforward path turned into a nearly two-year process!
Even for a highly motivated household which had budgeted significant sums for it all, it was still shocking how long (and much money) it took. It made me skeptical that households across California would be able to do the same to meet California’s climate goals without additional policy changes and financial support.
The Plan
Two years ago, we set out a plan:
Smart electrical panel — From my prior experience, I knew that many home electrification projects required a main electrical panel upgrade. These were typically costly and left you at the mercy of the utility to actually carry them out (I would find out how true this was later!). Our home had an older main panel rated for 125 A and we suspected we would normally need a main panel upgrade to add on all the electrical loads we were considering.
To try to get around this, we decided to get a smart electrical panel which could:
use software smarts to deal with the times where peak electrical load got high enough to need the entire capacity of the electrical line
give us the ability to intelligently manage backups and track solar production
In doing our research, Span seemed like the clear winner. They were the most prominent company in the space and had the slickest looking device and app (many of their team had come from Tesla). They also had an EV charger product we were interested in, the Span Drive.
Heat pumps — To electrify is to ditch natural gas. As the bulk of our gas consumption was heating air and water, this involved replacing our gas furnace and gas water heater with heat pumps. In addition to significant energy savings — heat pumps are famous for their >200% efficiency (as they move heat rather than “create” it like gas furnaces do) — heat pumps would also let us add air conditioning (just run the heat pump in reverse!) and improve our air quality (from not combusting natural gas indoors). We found a highly rated Bay Area HVAC installer who specializes in these types of energy efficiency projects (called Building Efficiency) and trusted that they would pick the right heat pumps for us.
Solar and Batteries — No electrification plan is complete without solar. Our goal was to generate as much clean electricity as possible to power our new electric loads. We also wanted energy storage for backup power during outages (something that, while rare, we seemed to run into every year) and to take advantage of time-of-use rates (by storing solar energy when the price of electricity is low and then using it when the price is high).
We looked at a number of solar installers and ultimately chose Sunrun. A friend of ours worked there at the time and spoke highly of a prepaid lease they offered that was vastly cheaper all-in than every alternative. It offered minimum energy production guarantees, came with a solid warranty, and the “peace of mind” that the installation would be done with one of the largest and most reputable companies in the solar industry.
EV Charger — Finally, with our plan to buy an electric vehicle, installing a home charger at the end of the electrification project was a simple decision. This would allow us to conveniently charge the car at home, and, with solar & storage, hopefully let us “fuel up” more cost effectively. Here, we decided to go with the Span Drive. It’s winning feature was the ability to provide Level 2 charging speeds without a panel upgrade (it does this by ramping up or down charging speeds depending on how much electricity the rest of the house needed). While pricey, the direct integration into our Span smart panel (and its app) and the ability to hit high charging rates without a panel upgrade felt like the smart path forward.
What We Left Out — There were two appliances we decided to defer “fully going green” on.
The first was our gas stove (with electric oven). While induction stoves have significant advantages, because our current stove is still relatively new, works well, uses relatively little gas, and an upgrade would have required additional electrical work (installing a 240 V outlet), we decided to keep our current stove and consider a replacement at it’s end of life.
The second was our electric resistive dryer. While heat pump based dryers would certainly save us a great deal of electricity, the existing heat pump dryers on the market have much smaller capacities than traditional resistive dryers, which may have necessitated our family of four doing additional loads of drying. As our current dryer was also only a few years old, and already running on electricity, we decided we would also wait to consider heat pump dryer only after it’s end of life.
With what we thought was a well-considered plan, we set out and lined up contractors.
But as Mike Tyson put it, “Everyone has a plan ’till they get punched in the face.”
The Actual Timeline
Smart Panel
The smart panel installation was one of the more straightforward parts of our electrification journey. Span connected us with a local electrician who quickly assessed our site, provided an estimate, and completed the installation in a single day. However, getting the permits to pass inspection was a different story.
We failed the first inspection due to a disagreement over the code between the electrician and the city inspector. This issue nearly turned into a billing dispute with the electrician, who wanted us to cover the extra work needed to meet the code (an unexpected cost). Fortunately, after a few adjustments and a second inspection, we passed.
The ability to control and monitor electric flows with the smart panel is incredibly cool. For the first few days, I checked the charts in the apps every few minutes tracking our energy use while running different appliances. It was eye-opening to see just how much power small, common household items like a microwave or an electric kettle could draw!
However, the true value of a smart panel is only achieved when it’s integrated with batteries or significant electric loads that necessitate managing peak demand. Without these, the monitoring and control benefits are more novelties and might not justify the cost.
Note: if you, like us, use Pihole to block tracking ads, you’ll need to disable it for the Span app. The app uses some sort of tracker that Pihole flags by default. It’s an inconvenience, but worth mentioning for anyone considering this path.
Heating
Building Efficiency performed an initial assessment of our heating and cooling needs. We had naively assumed they’d be able to do a simple drop-in replacement for our aging gas furnace and water heater. While the water heater was a straightforward replacement (with a larger tank), the furnace posed more challenges.
Initially, they proposed multiple mini-splits to provide zoned control, as they felt the crawlspace area where the gas furnace resided was too small for a properly sized heat pump. Not liking the aesthetics of mini-splits, we requested a proposal involving two central heat pump systems instead.
Additionally, during the assessment, they found some of our old vents, in particular the ones sending air to our kids’ rooms, were poorly insulated and too small (which explains why their rooms always seemed under-heated in the winter). To fix this, they had to cut a new hole through our garage concrete floor (!!) to run a larger, better-insulated vent from our crawlspace. They also added insulation to the walls of our kids’ rooms to improve our home’s ability to maintain a comfortable temperature (but which required additional furniture movement, drywall work, and a re-paint).
Building Efficiency spec’d an Ecobee thermostat to control the two central heat pumps. As we already had a Nest Learning Thermostat (with Nest temperature sensors covering rooms far from the thermostat), we wanted to keep our temperature control in the Nest app. At the time, we had gotten a free thermostat from Nest after signing with Sunrun. We realized later, what Sunrun gifted us was the cheaper (and, less attractive) Nest Thermostat which doesn’t support Nest temperature sensors (why?), so we had to buy our own Nest Learning Thermostat to complete the setup.
Despite some of these unforeseen complexities, the whole process went relatively smoothly. There were a few months of planning and scheduling, but the actual installation was completed in about a week. It was a very noisy (cutting a hole through concrete is not quiet!) and chaotic week, but, the process was quick, and the city inspection was painless.
Solar & Storage
The installation of solar panels and battery storage was a lengthy ordeal. Sunrun proposed a system with LONGI solar panels, two Tesla Powerwalls, a SolarEdge inverter, and a Tesla gateway. Despite the simplicity of the plan, we encountered several complications right away.
First, a main panel upgrade was required. Although we had installed the Span smart panel to avoid this, Sunrun insisted on the upgrade and offered to cover the cost. Our utility PG&E took over a year (!!) to approve our request, which started a domino of delays.
After PG&E’s approval, Sunrun discovered that local ordinances needed a concrete pad to be poured and safety fence erected around the panel, requiring a subcontractor and yet more coordination.
After the concrete pad was in place and the panel installed, we faced another wait for PG&E to connect the new setup. Ironically, during this wait, I received a request from Sunrun to pour another concrete pad. This was, thankfully, a false alarm and occurred because the concrete pad / safety fence work had not been logged in Sunrun’s tracking system!
The solar and storage installation itself took only a few days, but during commissioning, a technician found that half the panels weren’t connected properly, necessitating yet another visit before Sunrun could request an inspection from the city.
Sadly, we failed our first city inspection. Sunrun’s team had missed a local ordinance that required the Powerwalls to have a minimum distance between them and the sealing off of vents within a certain distance from each Powerwall. This necessitated yet another visit from Sunrun’s crew, and another city inspection (which we thankfully passed).
The final step was obtaining Permission to Operate (PTO) from PG&E. The application for this was delayed due to a clerical error. About four weeks after submission, we finally received approval.
Seeing the flow of solar electricity in my Span app (below) almost brought a tear to my eye. Finally!
EV Charger
When my wife bought a Nissan Ariya in early 2023, it came with a year of free charging with EVgo. We hoped this would allow us enough time to install solar before needing our own EV charger. However, the solar installation took longer than expected (by over a year!), so we had to expedite the installation of a home charger.
Span connected us with the same electrician who installed our smart panel. Within two weeks of our free charging plan expiring, the Span Drive was installed. The process was straightforward, with only two notable complications we had to deal with:
The 20 ft cable on the Span Drive sounds longer than it is in practice. We adjusted our preferred installation location to ensure it comfortably reached the Ariya’s charging port.
The Span software initially didn’t recognize the Span Drive after installation. This required escalated support from Span to reset the software, costing the poor electrician who had expected the commissioning step to be a few minute affair to stick around my home for several hours.
Result
So, “was it worth it?” Yes! There are significant environmental (our carbon footprint is meaningfully lower) benefits. But there were also quality of life improvements and financial gains from these investments in what are just fundamentally better appliances.
Quality of Life
Our programmable, internet-connected water heater allows us to adjust settings for vacations, saving energy and money effortlessly. It also lets us program temperature cycles to avoid peak energy pricing, heating water before peak rates hit.
With the new heat pumps, our home now has air conditioning, which is becoming increasingly necessary in the Bay Area’s warmer summers. Improved vents and insulation have also made our home (and, in particular, our kids’ rooms) more comfortable. We’ve also found that the heat from the heat pumps is more even and less drying compared to the old gas furnace, which created noticeable hot spots.
Backup power during outages is another significant benefit. Though we haven’t had to use it since we received permission to operate, we had an accidental trial run early on when a Sunrun technician let our batteries be charged for a few days in the winter. During two subsequent outages in the ensuing months, our system maintained power to our essential appliances, ensuring our kids didn’t even notice the disruptions!
The EV charger has also been a welcome change. While free public charging was initially helpful, reliably finding working and available fast chargers could be time-consuming and stressful. Now, charging at home is convenient and cost-effective, reducing stress and uncertainty.
Financial
There are two financial aspects to consider: the cost savings from replacing gas-powered appliances with electric ones and the savings from solar and storage.
On the first, the answer is not promising.
The chart below comes from our PG&E bill for Jan 2023. It shows our energy usage year-over-year. After installing the heat pumps in late October 2022, our natural gas consumption dropped by over 98% (from 5.86 therms/day to 0.10), while our electricity usage more than tripled (from 15.90 kWh/day to 50.20 kWh/day). Applying the conversion of 1 natural gas therm = ~29 kWh of energy shows that our total energy consumption decreased by over 70%, a testament to the much higher efficiency of heat pumps.
Our PG&E bill from Feb 2023 (for Jan 2023)
Surprisingly, however, our energy bills remained almost unchanged despite this! The graph below shows our PG&E bills over the 12 months ending in Jan 2023. Despite a 70% reduction in energy consumption, the bill stayed roughly the same. This is due to the significantly lower cost of gas in California compared to the equivalent amount of energy from electricity. It highlights a major policy failing in California: high electricity costs (relative to gas) will deter households from switching to greener options.
Our PG&E bill from Feb 2023 (for Jan 2023)
Solar, however, is a clear financial winner. With our prepaid lease, we’d locked in savings compared to 2022 rates (just by dividing the total prepaid lease amount by the expected energy production over the lifetime of the lease), and these savings have only increased as PG&E’s rates have risen (see chart below).
Batteries, on the other hand, are much less clear-cut financially due to their high initial cost and only modest savings from time-shifting electricity use. However, the peace of mind from having backup power during outages is valuable (not to mention the fact that, without a battery, solar panels can’t be used to power your home during an outage), and, with climate change likely to increase both peak/off-peak rate disparities and the frequency of outages, we believe this investment will pay off in the long run.
Taking Advantage of Time of Use Rates
Time of Use (TOU) rates, like PG&E’s electric vehicle time of use rates, offer a smart way to reduce electricity costs for homes with solar panels, energy storage, and smart automation. This approach has fundamentally changed how we manage home energy use. Instead of merely conserving energy by using efficient appliances or turning off devices when not needed, we now view our home as a giant configurable battery. We “save” energy when it’s cheap and use it when it’s expensive.
Backup Reserve: We’ve set our Tesla Powerwall to maintain a 25% reserve. This ensures we always have a good supply of backup power for essential appliances (roughly 20 hours for our highest priority circuits by the Span app’s latest estimates) during outages
Summer Strategy: During summer, our Powerwall operates in “Self Power” mode, meaning solar energy powers our home first, then charges the battery, and lastly any excess goes to the grid. This maximizes the use of our “free” solar energy. We also schedule our heat pumps to run during midday when solar production peaks and TOU rates are lower. This way, we “store” cheaper energy in the form of pre-chilled or pre-heated air and water which helps maintain the right temperatures for us later (when the energy is more expensive).
Winter Strategy: In winter, we will switch the Powerwall to “Time-Based Control.” This setting preferentially charges the battery when electricity is cheap and discharges it when prices are high, maximizing the financial value of our solar energy during the months where solar production is likely to be limited.
This year will be our first full cycle with all systems in place, and we expect to make adjustments as rates and energy usage evolve. For those considering home electrification, hopefully these strategies give hints to what is possible to improve economic value of your setup.
Takeaways
Two years is too long: The average household might not have started this journey if they knew the extent of time and effort involved. This doesn’t even consider the amount of carbon emissions from running appliances off grid energy due to the delays. Streamlining the process is essential to make electrification more accessible and appealing.
Align gas and electricity prices with climate goals: The current pricing dynamics make it financially challenging for households to switch from gas appliances to greener options like heat pumps. To achieve California’s ambitious climate goals, it’s crucial to align the cost of electricity more closely with electrification.
Streamline permitting: Electrification projects are slowed by complex, inconsistent permitting requirements across different jurisdictions. Simplifying and unifying these processes will reduce time and costs for homeowners and their contractors.
Accelerate utility approvals: The two-year timeframe was largely due to delays from our local utility, PG&E. As utilities lack incentives to expedite these processes, regulators should build in ways to encourage utilities to move faster on home electrification-related approvals and activities, especially as many homes will likely need main panel upgrades to properly electrify.
Improve financing accessibility: High upfront costs make it difficult for households to adopt electrification, even when there are significant long-term savings. Expanding financing options (like Sunrun’s leases) can encourage more households to invest in these technologies. Policy changes should be implemented so that even smaller installers have the ability to offer attractive financing options to their clients.
Break down electrification silos: Coordination between HVAC specialists, solar installers, electricians, and smart home companies is sorely missing today. As a knowledgeable early adopter, I managed to integrate these systems on my own, but this shouldn’t be the expectation if we want broad adoption of electrification. The industry (in concert with policymakers) should make it easier for different vendors to coordinate and for the systems to interoperate more easily in order to help homeowners take full advantage of the technology.
This long journey highlighted to me, in a very visceral way, both the rewards and practical challenges of home electrification. While the environmental, financial, and quality-of-life benefits are clear, it’s also clear that we have a ways to go on the policy and practical hurdles before electrification becomes an easy choice for many more households. I only hope policymakers and technologists are paying attention. Our world can’t wait much longer.
It was quite the shock when I discovered recently (HT: Axios Markets newsletter) that, according to NerdWallet, California actually has some of the cheapest homeowners insurance rates in the country!
It begs the Econ 101 question — is it really that the cost of wildfires are too high? Or that the price insurance companies can charge (something heavily regulated by state insurance commissions) is kept too low / not allowed to vary enough based on actual fire risk?
Anyone who’s done any AI work is familiar with Huggingface. They are a repository of trained AI models and maintainer of AI libraries and services that have helped push forward AI research. It is now considered standard practice for research teams with something to boast to publish their models to Huggingface for all to embrace. This culture of open sharing has helped the field make its impressive strides in recent years and helped make Huggingface a “center” in that community.
However, this ease of use and availability of almost every publicly accessible model under the sun comes with a price. Because many AI models require additional assets as well as the execution of code to properly initialize, Huggingface’s own tooling could become a vulnerability. Aware of this, Huggingface has instituted their own security scanning procedures on models they host.
But security researchers at JFrog have found that even with such measures, have identified a number of models that exploit gaps in Huggingface’s scanning which allow for remote code execution. One example model they identified baked into a Pytorch model a “phone home” functionality which would initiate a secure connection between the server running the AI model and another (potentially malicious) computer (seemingly based in Korea).
The JFrog researchers were also able to demonstrate that they could upload models which would allow them to execute other arbitrary Python code which would not be flagged by Huggingface’s security scans.
While I think it’s a long way from suggesting that Huggingface is some kind of security cesspool, the research reminds us that so long as a connected system is both popular and versatile, there will always be the chance for security risk, and it’s important to keep that in mind.
As with other open-source repositories, we’ve been regularly monitoring and scanning AI models uploaded by users, and have discovered a model whose loading leads to code execution, after loading a pickle file. The model’s payload grants the attacker a shell on the compromised machine, enabling them to gain full control over victims’ machines through what is commonly referred to as a “backdoor”. This silent infiltration could potentially grant access to critical internal systems and pave the way for large-scale data breaches or even corporate espionage, impacting not just individual users but potentially entire organizations across the globe, all while leaving victims utterly unaware of their compromised state.
The human heart is an incredibly sophisticated organ that, in addition to being one of the first organs developed while embryos develop, is quite difficult to understand at a cellular level (where are the cells, how do they first develop, etc.).
Neil Chi’s group at UCSD (link to Nature paper) were able to use multiplex imaging of fluorescent-tagged RNA molecules to profile the gene expression profiles of different types of heart cells and see where they are located and how they develop!
The result is an amazing visualization, check it out at the video:
Once upon a time, the hottest thing in chip design was “system-on-a-chip” (SOC). The idea is that you’d get the best cost and performance out of a chip by combining more parts into one piece of silicon. This would result in smaller area (less silicon = less cost) and faster performance (closer parts = faster communication) and resulted in more and more chips integrating more and more things.
While the laws of physics haven’t reversed any of the above, the cost of designing chips that integrate more and more components has gone up sharply. Worse, different types of parts (like on-chip memory and physical/analog componentry) don’t scale down as well as pure logic transistors, making it very difficult to design chips that combine all these pieces.
The rise of new types of packaging technologies, like Intel’s Foveros, Intel’s EMIB, TSMC’s InFO, new ways of separating power delivery from data delivery (backside power delivery), and more, has also made it so that you can more tightly integrate different pieces of silicon and improve their performance and size/cost.
The result is now that many of the most advanced silicon today is built as packages of chiplets rather than as massive SOC projects: a change that has happened over a fairly short period of time.
This interview with IMEC (a semiconductor industry research center)’s head of logic technologies breaks this out…
What we’re doing in CMOS 2.0 is pushing that idea further, with much finer-grained disintegration of functions and stacking of many more dies. A first sign of CMOS 2.0 is the imminent arrival of backside-power-delivery networks. On chips today, all interconnects—both those carrying data and those delivering power—are on the front side of the silicon [above the transistors]. Those two types of interconnect have different functions and different requirements, but they have had to exist in a compromise until now. Backside power moves the power-delivery interconnects to beneath the silicon, essentially turning the die into an active transistor layer which is sandwiched between two interconnect stacks, each stack having a different functionality.
Immune cell therapy — the use of modified immune cells directly to control cancer and autoimmune disease — has shown incredible results in liquid tumors (cancers of the blood and bone marrow like lymphoma, leukemia, etc), but has stumbled in addressing solid tumors.
Iovance, which recently had its drug lifileucel approved by the FDA to treat advanced melanoma, has demonstrated an interesting spin on the cellular path which may prove to be effective in solid tumors. They extract Tumor-Infiltrating Lymphocytes (TILs), immune cells that are already “trying” to attack a solid tumor directly. Iovance then treats those TILs with their own proprietary process to expand the number of those cells and “further activate” them (to resist a tumor’s efforts to inactivate immune cells that may come after them) before reintroducing them to the patient.
This is logistically very challenging (not dissimilar to what patients awaiting other cell therapies or Vertex’s new sickle cell treatment need to go through) as it also requires chemotherapy for lymphocyte depletion in the patient prior to reintroduction of the activated TILs. But, the upshot is that you now have an expanded population of cells known to be predisposed to attacking a solid tumor that can now resist the tumor’s immune suppression efforts.
To me, the beauty of this method is that it can work across tumor types. Iovance’s process (from what I’ve gleamed from their posters & presentations) works by getting more and more activated immune cells. Because they’re derived from the patient, these cells are already predisposed to attack the particular molecular targets of their tumor.
This is contrast to most other immune cell therapy approaches (like CAR-T) where the process is inherently target-specific (i.e. get cells that go after this particular marker on this particular tumor) and each new target / tumor requires R&D work to validate. Couple this with the fact that TILs are already the body’s first line of defense against solid tumors and you may have an interesting platform for immune cell therapy in solid tumors.
The devil’s in the details and requires more clinical study on more cancer types, but suffice to say, I think this is incredibly exciting!
Its clearance is the “culmination of scientific and clinical research efforts,” said Peter Marks, director of the FDA’s Center for Biologics Evaluation and Research, in a statement.
So, you watched Silicon Valley and read some articles on Techcrunch and you envision yourself as a startup CEO 🤑. What does it take to succeed? Great engineering skills? Salesmanship? Financial acumen?
As someone who has been on both sides of the table (as a venture investor and on multiple startup executive leadership teams), there are three — and only three — things a startup CEO needs to master. In order of importance:
Raise Money from Investors(now and in the future): The single most important job of a startup CEO is to secure funding from investors. Funding is the lifeblood of a company, and raising it is a job that only the CEO can drive. Not being great at it means slower growth / fewer resources, regardless of how brilliant you are, or how great your vision. Being good at raising money buys you a lot of buffer in every other area.
Hire Amazing People into the Right Roles(and retain them!): No startup, no matter how brilliant the CEO, succeeds without a team. Thus, recruiting the right people into the right positions is the second most vital job of a CEO. Without the right people in place, your plans are not worth the paper on which they are written. Even if you have the right people, if they are not entrusted with the right responsibilities or they are unhappy, the wrong outcomes will occur. There is a reason that when CEOs meet to trade notes, they oftentimes trade recruiting tips.
Inspire the Team During Tough Times: Every startup inevitably encounters stormy seas. It could be a recession causing a slowdown, a botched product launch, a failed partnership, or the departure of key employees. During these challenging times, the CEO’s job is to serve as chief motivator. Teams that can resiliently bounce back after crises can stand a better chance of surviving until things turn a corner.
It’s a short list. And it doesn’t include:
deep technical expertise
an encyclopedic knowledge of your industry
financial / accounting skills
marketing wizardry
design talent
intellectual property / legal acumen
It’s not that those skills aren’t important for building a successful company — they are. It’s not even that these skills aren’t helpful for a would-be startup CEO — these skills would be valuable for anyone working at a startup to have. For startup CEOs in particular, these skills can help sell investors as to why the CEO is the right one to invest in or convince talent to join or inspire the team that the strategy a CEO has chosen is the right one.
But, the reality is that these skills can be hired into the company. They are not what separates great startup CEOs from the rest of the pack.
What makes a startup CEO great is their ability to nail the jobs that cannot be delegated. And that boils down to fundraising, hiring and retaining the best, and lifting spirits when things are tough. And that is the job.
After all, startup investors write checks because they believe in the vision and leadership of a CEO, not a lackey. And startup employees expect to work for a CEO with a vision, not just a mouthpiece.
So, want to become a startup CEO? Work on:
Storytelling — Learn how to tell stories that compel listeners. This is vital for fundraising (convincing investors to take a chance on you because of your vision), but also for recruiting & retaining people as well as inspiring a team during difficult times.
Reading People — Learn how to accurately read people. You can’t hire a superstar employee with other options, retain an unhappy worker through tough times, or overcome an investor’s concerns unless you understand their position. This means being attentive to what they tell you directly (i.e., over email, text, phone / video call, or in person, etc.) as well as paying attention to what they don’t (i.e., body language, how they act, what topics they discussed vs. didn’t, etc.).
Prioritization — Many startup CEOs got to where they are because they were superstars at one or more of the “unnecessary to be a great startup CEO” skills. But, continuing to focus on that skill and ignoring the skills that a startup CEO needs to be stellar at confuses the path to the starting point with the path to the finish line. It is the CEO’s job to prioritize those tasks that they cannot delegate and to ruthlessly delegate everything else.
Randomized controlled trials (RCTs) are the “gold standard” in healthcare for proving a treatment works. And for good reason. A well-designed and well-powered (i.e., large enough) clinical trial establishes what is really due to a treatment as opposed to another factor (e.g., luck, reversion to the mean, patient selection, etc.), and it’s a good thing that drug regulation is tied to successful trial results.
But, there’s one wrinkle. Randomized controlled trials are not reality.
RCTs are tightly controlled, where only specific patients (those fulfilling specific “inclusion criteria”) are allowed to participate. Follow-up is organized and adherence to protocol is tightly tracked. Typically, related medical care is also provided free of cost.
This is exactly what you want from a scientific and patient volunteer safety perspective, but, as we all know, the real world is messier. In the real world:
Physicians prescribe treatments to patients that don’t have to fit the exact inclusion criteria of the clinical trial. After all, many clinical trials exclude people who are extremely sick or who are children or pregnant.
Patients may not take their designated treatment on time or in the right dose … and nobody finds out.
Follow-up on side effects and progress is oftentimes random
Cost and free time considerations may change how and when a patient comes in
Physicians also have greater choice in the real world. They only prescribe treatments they think will work, whereas in a RCT, you get the treatment you’ve been randomly assigned to.
These differences beg the question: just how different is the real world from an randomized controlled trial?
A group in Canada studied this question and presented their findings at the recent ASH (American Society of Hematology) meeting. The researchers looked at ~4,000 patients in Canada with multiple myeloma, a cancer with multiple treatment regimens that have been developed and approved, and used Canada’s national administrative database to track how they did after 7 different treatment regimes and compared it to published RCT results for each treatment.
The findings are eye-opening. While there is big variation from treatment to treatment, in general, real world effectivenesswas significantly worse, by a wide margin, than efficacy published in randomized controlled trial (see table below).
While the safety profiles (as measured by the rate of “adverse events”) seemed similar between real world and RCT, real world patients did, in aggregate, 44% worse on progression free survival and 75% worse on overall survival when compared with their RCT counterparts!
The only treatment where the real world did better than the RCT was in a study where it’s likely the trial volunteers were much sicker than on average. (Note: that one of seven treatment regimes went the other way but the aggregate still is 40%+ worse shows you that some of the comparisons were vastly worse)
The lesson here is not that we should stop doing or listening to randomized controlled trials. After all, this study shows that they were reasonably good at predicting safety, not to mention that they continue to be our only real tool for establishing whether a treatment has real clinical value prior to giving it to the general public.
But this study imparts two key lessons for healthcare:
Do not assume that the results you see in a clinical trial are what you will see in the real world. Different patient populations, resources, treatment adherence, and many other factors will impact what you see.
Especially for treatments we expect to use with many people, real world monitoring studies are valuable in helping to calibrate expectations and, potentially, identify patient populations where a treatment is better or worse suited.
The 2022 CHIPS and Science Act earmarked hundreds of billions in subsidies and tax credits to bolster a U.S. domestic semiconductor (and especially semiconductor manufacturing) industry. If it works, it will dramatically reposition the U.S. in the global semiconductor value chain (especially relative to China).
With such large amounts of taxpayer money practically “gifted” to large (already very profitable) corporations like Intel, the U.S. taxpayer can reasonably assume that these funds should be allocated carefully and thoughtfully and with processes in place to make sure every penny furthered the U.S.’s strategic goals.
But, when the world’s financial decisions are powered by Excel spreadsheets, even the best laid plans can go awry.
The team behind the startup Rowsie created a large language model (LLM)-powered tool which can understand Excel spreadsheets and answer questions posed to it. They downloaded a spreadsheet that the US government provided as an example of the information and calculations they want applicants fill out in order to qualify. They then applied their AI tool to the spreadsheet to understand it’s structure and formulas.
Interestingly, Rowsie was able to find a single-cell spreadsheet error (see images below) which resulted in a $178 million understatement of interest payments!
The Control Panel tab in the Example Pre-App-Simple-Financial-Model spreadsheet from the CHIPS Act funding application website. Notice cells C51 and D51 corresponding to the senior debt interest rate (5%) and the subordinated debt interest rate (8%)The Assumptions Processing tab in the Example Pre-App-Simple-Financial-Model spreadsheet from the CHIPS Act funding application website. Notice row 50. Despite the section being about Subordinated Debt (see Cell B50), they’re using cell C51 from the Control Panel tab (which points to the Senior Debt rate of 5%) rather than the correct cell of D51 (which points to the Subordinated Debt rate of 8%).
To be clear, this is not a criticism of the spreadsheet’s architects. In this case, what seems to have happened, is that the spreadsheet creator copied an earlier row (row 40) and forgot to edit the formula to account for the fact that row 50 is about subordinated debt and row 40 is about senior debt. It’s a familiar story to anyone who’s ever been tasked with doing something complicated in Excel. Features like copy and paste and complex formulas are very powerful, but also make it very easy for a small mistake to cascade. It’s also remarkably hard to catch!
Hopefully the Department of Commerce catches on and fixes this little clerical mishap, and that applicants are submitting good spreadsheets, free of errors. But, this case underscores how (1) so many of the world’s financial and policy decisions rest on Excel spreadsheets and you just have to hope 🤞🏻 no large mistakes were made, and (2) the potential for tools like Rowsie to be tireless proofreaders and assistants who can help us avoid mistakes and understand those critical spreadsheets quickly.
Section 230 of the Communications Decency Act has been rightfully called “the twenty-six words that created the Internet.” It is a valuable legal shield which allows internet hosts and platforms the ability to distribute user-generated content and practice moderation without unreasonable fear of being sued, something which forms the basis of all social media, user review, and user forum, and internet hosting services.
While I think it’s reasonable to modify Section 230 to obligate platforms to help victims of clearly heinous acts like cyberstalking, swatting, violent threats, and human rights violations, what the Democratic Senators are proposing goes far beyond that in several dangerous ways.
First, Warner and his colleagues have proposed carving out from Section 230 all content which accompanies payment (see below). While I sympathize with what I believe was the intention (to put a different bar on advertisements), this is remarkably short-sighted, because Section 230 applies to far more than companies with ad / content moderation policies Democrats dislike such as Facebook, Google, and Twitter.
It also encompasses email providers, web hosts, user generated review sites, and more. Any service that currently receives payment (for example: a paid blog hosting service, any eCommerce vendor who lets users post reviews, a premium forum, etc) could be made liable for any user posted content. This would make it legally and financially untenable to host any potentially controversial content.
Secondly, these rules will disproportionately impact smaller companies and startups. This is because these smaller companies lack the resources that larger companies have to deal with the new legal burdens and moderation challenges that such a change to Section 230 would call for. It’s hard to know if Senator Warner’s glip answer in his FAQ that people don’t litigate small companies (see below) is ignorance or a willful desire to mislead, but ask tech startups how they feel about patent trolls and whether or not being small protects them from frivolous lawsuits
Third, the use of the language “affirmative defense” and “injunctive relief” may have far-reaching consequences that go beyond minor changes in legalese (see below). By reducing Section 230 from an immunity to an affirmative defense, it means that companies hosting content will cease to be able to dismiss cases that clearly fall within Section 230 because they now have a “burden of [proof] by a preponderance of the evidence.”
Similarly, carving out “injunctive relief” from Section 230 protections (see below) means that Section 230 doesn’t apply if the party suing is only interested in taking something down (but not financial damages)
I suspect the intention of these clauses is to make it harder for large tech companies to dodge legitimate concerns, but what this practically means is that anyone who has the money to pursue legal action can simply tie up any internet company or platform hosting content that they don’t like.
That may seem like hyperbole, but this is what happened in the UK until 2014 where libel / slander laws making it easy for wealthy individuals and corporations to sue anyone for negative press due to weak protections. Imagine Jeffrey Epstein being able to sue any platform for carrying posts or links to stories about his actions or any individual for forwarding an unflattering email about him.
There is no doubt that we need new tools and incentives (both positive and negative) to tamp down on online harms like cyberbullying and cyberstalking, and that we need to come up with new and fair standards for dealing with “fake news”. But, it is distressing that elected officials will react by proposing far-reaching changes that show a lack of thoughtfulness as it pertains to how the internet works and the positives of existing rules and regulations.
It is my hope that this was only an early draft that will go through many rounds of revisions with people with real technology policy and technology industry expertise.
If you’ve been exposed to any financial news in the last few days, you’ll have heard of Gamestop, the mostly brick and mortar video gaming retailer who’s stock has been caught between many retail investors on the subreddit r/WallstreetBets and hedge fund Melvin Capital which had been actively betting against the company. The resulting short squeeze (where a rising stock price forces investors betting against a company to buy shares to cover their own potential losses — which itself can push the stock price even higher) has been amazing to behold with the worth of Gamestop shares increasing over 10-fold in a matter of months.
While it’s hard not to get swept up in the idea of “the little guy winning one over on a hedge fund”, the narrative that this is Main Street winning over Wall Street is overblown.
First, speaking practically, it’s hard to argue that giving one hedge fund a black eye by making Gamestop executives & directors and large investment funds holding $100M’s of Gamestop prior to the increase wealthier is anyone winning anything over on Wall Street. And that’s not even accounting for the fact that hedge funds are usually managing a significant amount of money on behalf of pension funds and foundation / university endowments.
Second, while the paper value of recent investments in Gamestop has clearly jumped through the roof, what these investors will actually “win” is unclear. Even holding aside short-term capital gains taxes that many retail investors are unclear on, the reality is that, to make money on an investment, you not only have to buy low, you have to successfully sell high. By definition, any company experiencing a short-squeeze is volume-limited — meaning that it’s the lack of sellers that is causing the increase in price (the only way to get someone to sell is to offer them a higher price). If the stock price changes direction, it could trigger a flood of investors flocking to sell to try to hold on to their gains which can create the opposite problem: too many people trying to sell relative to people trying to buy which can cause the price to crater.
Regulatory and legal experts are better suited to weigh in on whether or not this constitutes market manipulation that needs to be regulated. For whatever it’s worth, I personally feel that Redditors egging each other on is no different than an institutional investor hyping their investments on cable TV.
While many retail investors view these restrictions as a move by Wall Street to screw the little guy, there’s a practical reality here that the brokerages are probably fearful of:
Lawsuits from investors, some of whom will eventually lose quite a bit of money here
SEC actions and punishments due to eventual outcry from investors losing money
I love stories of hedge funds facing the consequences of the risks they take on — but the idea that this is a clear win for Main Street is suspect (as is the idea that the right answer for most retail investors is to HODL through thick and through thin).
I’ve been a big fan of moving my personal page over to AWS Lightsail. But, if I had one complaint, it’s the dangerous combination of (1) their pre-packaged WordPress image being hard to upgrade software on and (2) the training-wheel-lacking full root access that Lightsail gives to its customers. That combination led me to make some regrettable mistakes yesterday which resulted in the complete loss of my old blog posts and pages.
It’s the most painful when you know your problems are your own fault. Thankfully, with the very same AWS Lightsail, it’s easy enough to start up a new WordPress instance. With the help of site visit and search engine analytics, I’ve prioritized the most popular posts and pages to resurrect using Google’s cache.
Unfortunately, that process led to my email subscribers receiving way too many emails from me as I recreated each post. For that, I’m sorry — mea culpa — it shouldn’t happen again.
I’ve come to terms with the fact that I’ve lost the majority of the 10+ years of content I’ve created. But, I’ve now learned the value of systematically backing up things (especially my AWS Lightsail instance), and hopefully I’ll write some good content in the future to make up for what was lost.


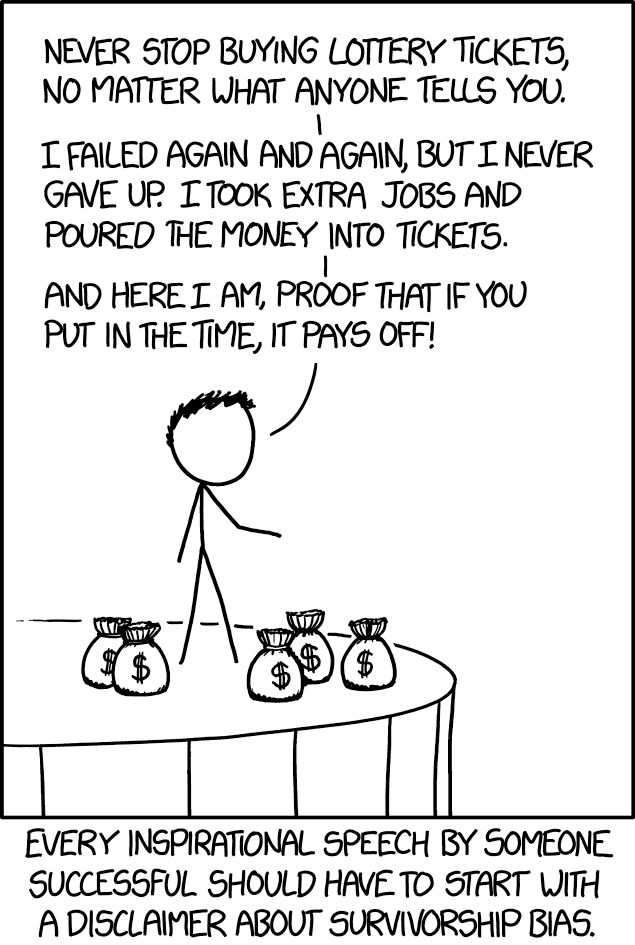


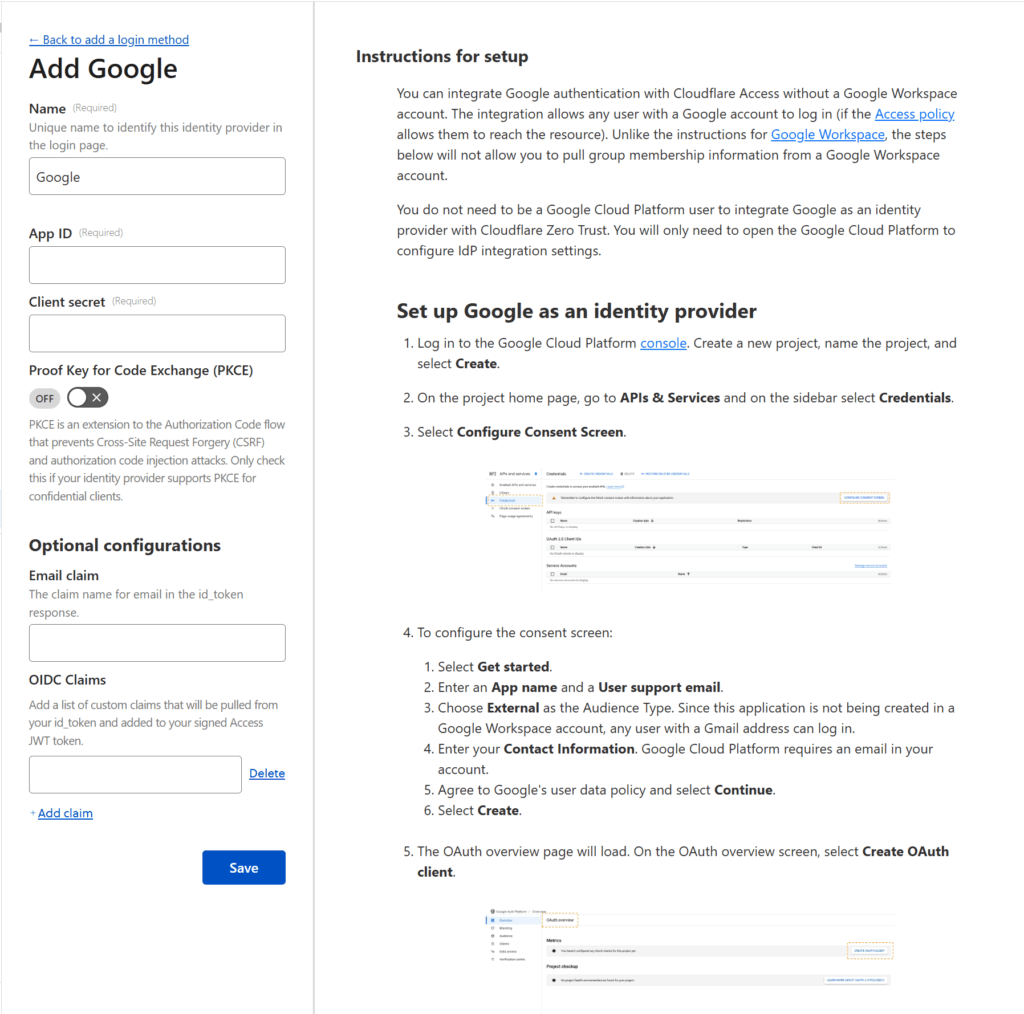


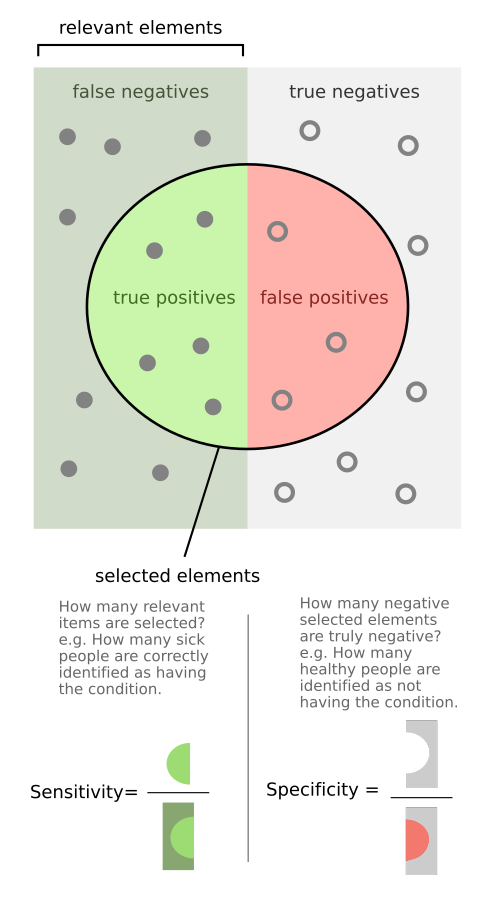

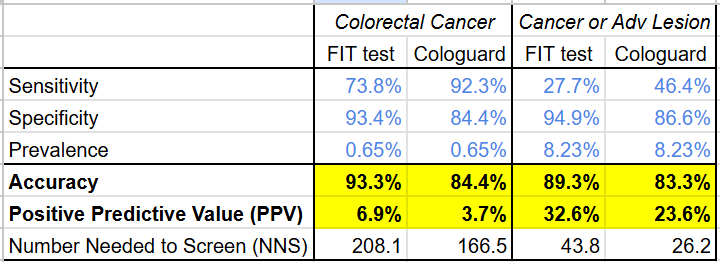
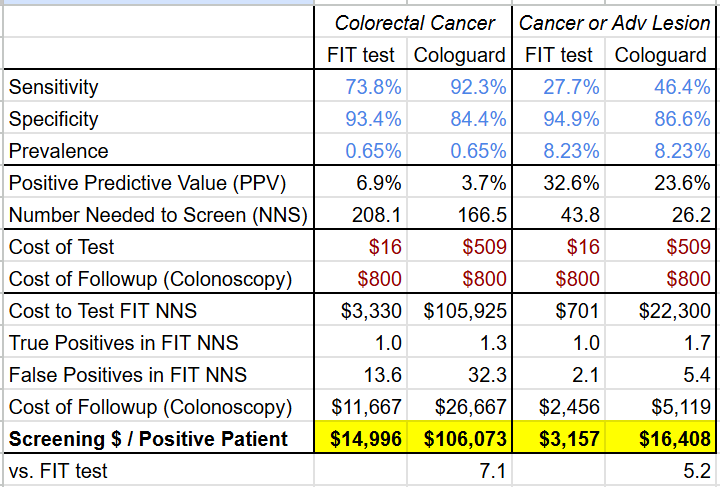

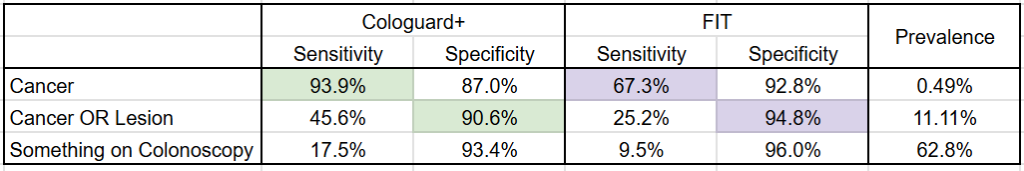
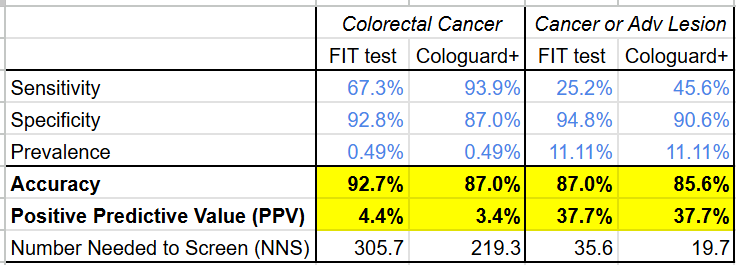

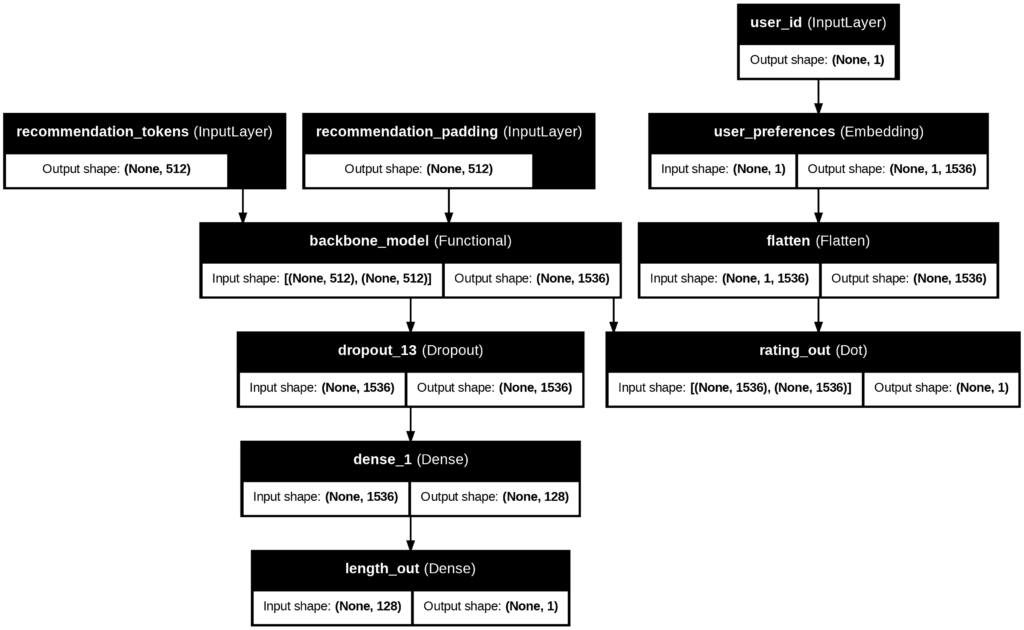

_(36375553176).jpg)


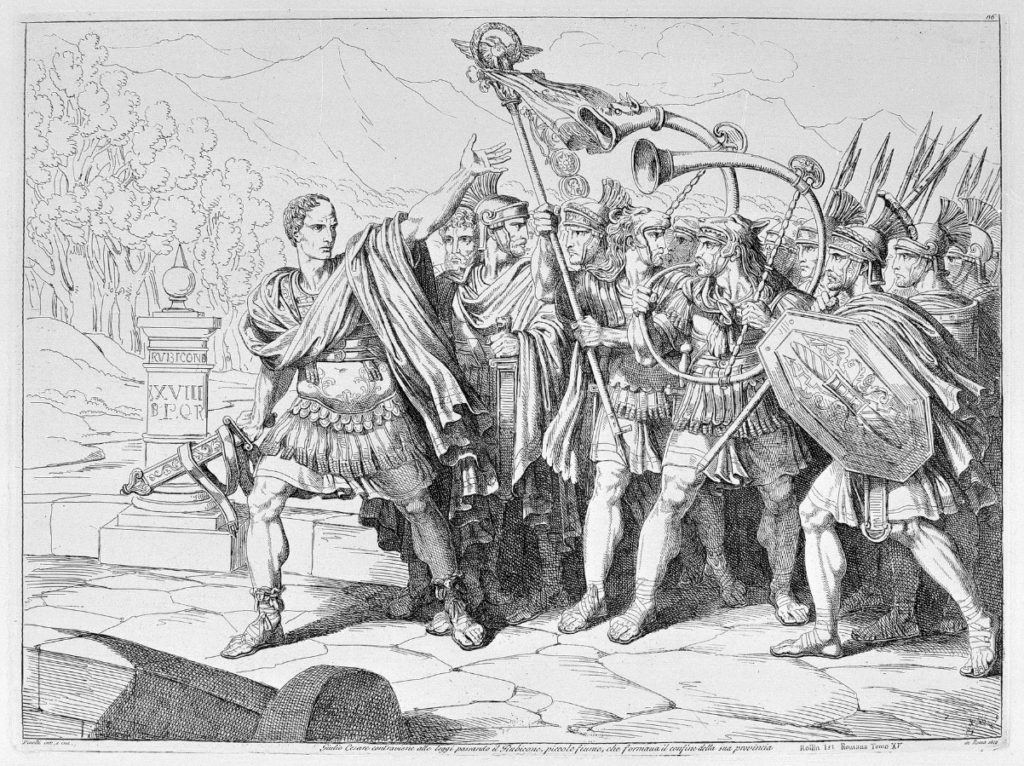


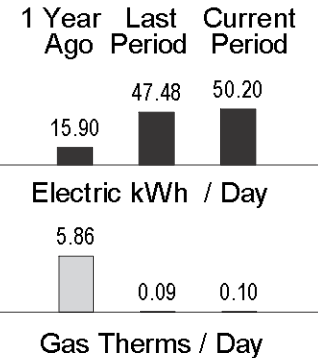

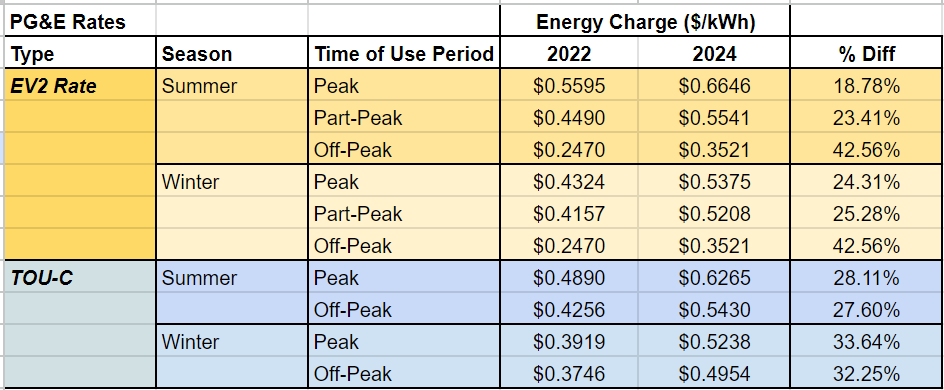


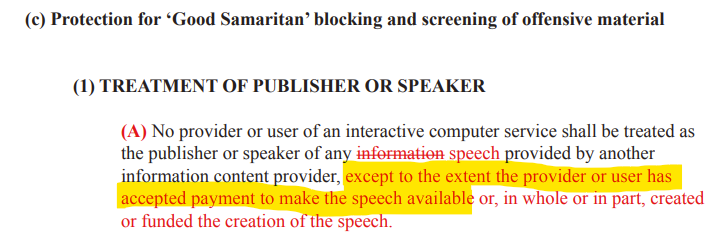
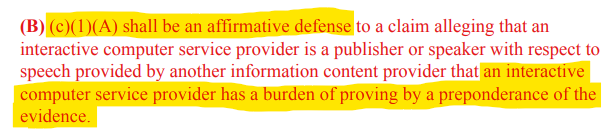
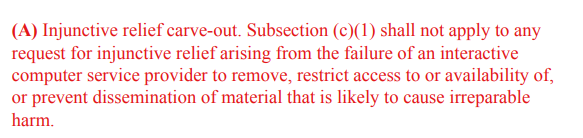


